- Open access
- Published:
Shear Crack Control for High Strength Reinforced Concrete Beams Considering the Effect of Shear-Span to Depth Ratio of Member
International Journal of Concrete Structures and Materials volume 10, pages 407–424 (2016)
Abstract
This study tests ten full-size simple-supported beam specimens with the high-strength reinforcing steel bars (SD685 and SD785) using the four-point loading. The measured compressive strength of the concrete is in the range of 70–100 MPa. The main variable considered in the study is the shear-span to depth ratio. Based on the experimental data that include maximum shear crack width, residual shear crack width, angle of the main crack and shear drift ratio, a simplified equation are proposed to predict the shear deformation of the high-strength reinforced concrete (HSRC) beam member. Besides the post-earthquake damage assessment, these results can also be used to build the performance-based design for HSRC structures. And using the allowable shear stress at the peak maximum shear crack width of 0.4 and 1.0 mm to suggest the design formulas that can ensure serviceability (long-term loading) and reparability (short-term loading) for shear-critical HSRC beam members.
1 Introduction
High-strength concrete (HSC) has gradually transformed in use and scope for more than six decades, as mentioned by the American Concrete Institute (ACI 2010). HSC has a continuously expanding range of applications, owing to its highly desired characteristics such as a sufficiently high early age strength, low deflections owing to a high modulus elasticity, and high load resistance per unit weight (including shear and moment). HSC is thus highly effective in constructing skyscrapers and span suspension bridges. HSC commonly refers to concrete whose compressive strength equals or exceeds 60 MPa and less than 130 MPa (FIP/CEB 1990). High-strength reinforcement is increasingly common in the construction industry. In Taiwan, high-strength reinforced concrete (HSRC) should include HRC with a specified compressive strength of at least 70 MPa and high-strength reinforcement with a specified yield strength of at least 685 MPa. Meanwhile, as the most common specification for concrete engineering design in Taiwan, ACI 318 (2011) sets an upper bound of the yield strength of reinforcing steel bars to 420 MPa. Owing to the increasing strength of concrete and reinforcing steel, the mechanical behavior of HSRC structural members differs from that of normal-strength RC members. Additionally, few full-size experimental studies are focused on the mechanical behaviors of HSRC beam and column members. Therefore, mechanical models of HSRC members that accurately describe the lateral force–deformation relationship must be developed since the conventional model for normal-strength RC members may be infeasible for evaluating the performance of HSRC members or structures.
According to its design standard, the Architectural Institute of Japan (AIJ) (2010) states that building performance consists of serviceability, safety and reparability. Restated, in addition to serviceability and safety, the performance-based design of buildings should incorporate reparability as a factor. As a major determinant in the cost of a building over its life cycle, reparability can also be regarded as a basic economic performance metric of a building; its importance has become evident in many seismic disaster events, including the Northridge Earthquake (USA, 1994), the Kobe Earthquake (Japan, 1995), and the Chi–Chi Earthquake (Taiwan, 1999). Reparability can ultimately reduce reconstruction costs after a seismic disaster. Additionally, a crack-based damage assessment plays a major role in estimating repair costs of a building. Despite the numerous crack-based damage assessments of RC members or structures, related studies have focused mainly on normal-strength RC with little attention paid to HSRC structural members (Chiu et al. 2014 and Soltani et al. 2013). A crack-based damage assessment can also estimate post-earthquake residual seismic capacity or facilitate damage-controlled design (performance-based) for a building structure.
Given the emphasis on seismic capacity or safety of HSRC in related studies, this study presents design formulas that ensure the serviceability and reparability of HSRC beam members based on experimental results. Therefore, this study investigates the shear crack development of shear-critical HSRC beam members, especially with respect to the relationship between shear stresses and shear crack widths. By setting the allowable shear stress at the peak maximum shear crack width of 0.4 and 1.0 mm, this study also derives design formulas that can ensure serviceability (long-term loading) and reparability (short-term loading) for shear-critical HSRC beam members. Additionally, to quantify damage in nonlinear dynamic analysis, the relationship between shear crack width and deformation of a member should be determined based on experimental results in terms of the shear crack, results of which can help engineers to assess the performance or damage state of members under an earthquake in the structural analysis. Correspondingly, in this study, ten full-size simple-supported beam specimens with high-strength reinforcing steel bars (SD685 and SD785) are tested using four-point loading. Design compressive strength of the concrete is 70 and 100 MPa, and the shear-span to depth ratio is 1.75, 2.00, 2.75, 3.25 and 3.33. Additionally, investigation of the shear crack behavior of HSRC beam members also includes HSRC beam specimens with a shear-span to depth ratio of 3.33 conducted by Chiu et al. (2014).
2 Shear Crack Behavior of RC Beam and Column Members and Crack-Based Design Methods
This section introduces several researches corresponding to the shear crack behavior of RC beam and column members with the normal strength under the monotonic or cyclic loading. Additionally, crack-based performance design methods, including the crack-controlled design formulas and the relationship between the crack widths and deformation, are also described in this section.
2.1 Shear Crack Behavior of RC Members with Normal Strength
The research (Zakaria et al. 2009) presented an experiment investigation to clarify shear crack behavior of RC beams. It was found that shear crack width proportionally increases both with the strain of shear reinforcement and with the spacing between shear cracks. The test results also revealed that shear reinforcement characteristics (side concrete cover to stirrup, stirrup spacing and/or stirrup configuration) and longitudinal reinforcement ratio play a critical role in controlling the diagonal crack spacings and openings. Recently, prestressed reinforced concrete (PRC) has been accepted as a reasonable structural member that permits cracking. On the basis of the experiment program including the influence of prestressing force, side concrete cover, stirrup spacing, bond characteristics of stirrup and the amount of longitudinal reinforcement on shear crack width, the research (Silva et al. 2008) revealed that the prestressing force significantly reduced shear crack width in PRC beams as compared to RC beams.
2.2 Crack-Controlled Formulas and Shear Strength of Concrete for RC Beam and Column Members Suggested by Design Specifications
For the shear strength design of an RC beam or column member, the Japanese design standard (AIJ 2010) considers the long-term and short-term loadings, respectively, to set the design criteria for specified performances, including the serviceability, reparability and safety.
2.2.1 Allowable Shear Force Corresponding to Serviceability Ensuring
In the Japanese design standard (AIJ 2010), for beam and column members, controlling the occurrence of shear cracking under the long-term loading (summation of dead and live loadings) is the basic design concept for serviceability ensuring, as shown in Eq. (1). Furthermore, for a beam member, it can also be designed on the basis of Eq. (2) recommended in the guideline. According the research conducted by Shimazaki (2009), if the long-term loading is less than Eq. (2), the maximum shear crack width can be controlled within 0.3 mm.
where p w is the stirrup ratio (\( = \frac{{a_{w} }}{bs} \le 0.6\% \)); a w is the section area of stirrup in the range of stirrup spacing (mm2); s is the space of stirrup (mm); f cs is the long-term allowable shear stress of concrete (MPa); f ss is the long-term allowable tensile stress of stirrup (MPa); α is the modification factor of the span-depth ratio (\( =\! \frac{4}{{\frac{M}{Vd} + 1}} \)(\( 1 \le {{\alpha}} \le 2 \)); M is the maximum moment in the long-term loading (N-mm); V AL1 is the allowable shear force in the long-term loading) (N); b is the width of a cross-section (mm); j is the distance between the centroids of compressive and tensile steels (mm) and d is the effective depth of a cross-section (mm).
Besides of AIJ (1999, 2010) recommends Eq. (3), which is proposed on the basis of the maximum principal stress equal to the tensile strength of concrete, to estimate the shear crack force of concrete, V sc .
where \( h \) is the depth of a cross section (mm); f t is the tensile strength of reinforced concrete (=0.33\( \sqrt {f_{c}^{\prime} } \)) (MPa); f o is the applied axial stress (MPa) and \( \kappa \) is the shape factor (AIJ 1999). Additionally, Eq. (3) with a modification coefficient \( \phi \) of 0.51 can get relatively conservative results (AIJ 1999).
2.2.2 Allowable Shear Force Corresponding to Reparability Ensuring
In the Japanese design standard (AIJ 2010), for ensuring reparability of beam and column members, Eq. (4) can be used to control the damage under the short-term loading of a medium-magnitude earthquake. Additionally, according the research conducted by Shimazaki (2009), if the short-term loading of a medium-magnitude is less than Eq. (4), the residual maximum shear crack width can be controlled within 0.3 mm.
where V SL1 is the allowable shear force in the short-term loading (N); p w is the stirrup ratio (\( = \frac{{a_{w} }}{bs} \le 1.2\% \)); f c is the short-term allowable shear stress (MPa); f s is the short-term allowable tensile stress (MPa) (≤390 MPa). Additionally, for safety ensuring in AIJ (2010), Eq. (3) with short-term allowable stresses can be used to design beam and column members under the short-term loading of a large-magnitude earthquake.
For HSRC beam specimens in Chiu et al. (2014), the design formula (Eq. (2)) recommended in AIJ (2010) to ensure serviceability under long-term loading can be used to control the peak maximum shear crack width less than 0.3 mm. Additionally, Eq. (4), recommended in AIJ (2010), can be used to control the maximum residual shear crack width less than 0.3 mm for ensuring the reparability under the short-term loading that is induced by a medium-magnitude earthquake. However, the experimental results are limited to the shear-span to depth ratio of HSRC beams of 3.33. Therefore, for HSRC beams with various shear-span to depth ratios, it is still necessary to investigate the application of Eqs. (2) and (4) in the crack-controlled design for serviceability and reparability ensuring using the experiment.
2.2.3 Ultimate Shear Strength of Concrete Suggested by ACI 318 (2011) and JSCE (2007)
In ACI 318 (2011), Eq. (5), which is derived on the basis of the diagonal shear crack mechanism, is used to estimate the ultimate shear strength of concrete, v c . According to experimental results obtained from a lot of beam specimens without the stirrup, when a beam member has a high tension reinforcement ratio or low span-depth ratio, Eq. (5) can give a conservative prediction. Additionally, for the normal range of variables, Eq. (5) can be simplified to Eq. (6).
where \( f_{c}^{\prime} \) is the compression strength of concrete; \( \rho_{w} \) is the ratio of A s to b w d (A s is the total sectional area of nonprestressed tension reinforcement; b w is the width of web of a beam); V u is the design shear force of a member and M u is the design moment of a member.
In JSCE (2007), Eq. (7) is used to estimate the ultimate shear strength of concrete v cd considering the compressive strength of concrete, depth of member, longitudinal reinforcement ratio and axial force. Obviously, the ultimate shear strength of concrete increases with the compressive strength of concrete increasing. Additionally, for a beam or column with the small shear-span to depth ratio, since the arch mechanism occurs after the diagonal shear cracking, Eq. (9), which is proposed based on the shear-compression failure mode, is recommended to evaluate the ultimate shear strength of concrete, v dd .
where β d is the parameter related to the depth of member; β p is the parameter related to the main bar ratio; β n is the parameter of the axial force, β a is the parameter related to the shear-span to depth ratio; γ b is the modification factor of member and equal to 1.3 generally.
Besides of ACI 318 (2011) and JSCE (2007), this study also investigates the application of the design formula for the shear strength of RC beams and columns recommended in AIJ (1999) members, which is proposed on the basis of the truss-arch theory, on HSRC members. This study adopts the formulas suggested by the specifications stated above to investigate their application on the HSRC beam members.
2.3 Crack-Based Damage Assessment for RC Beams and Columns
Since the damage level is defined on the basis of the residual crack width, the quantification of the relationship between the residual deformation and residual crack widths is necessary in the performance-based design for HSRC buildings (2001). Residual deformation of a column and beam member is attributed the residual flexural crack widths, residual shear crack widths, bond slip of main bars and pullout displacement of main bars from the beam-column joint. According to the reference (AIJ 1999), the latter two contributions are negligible and can be disregarded. Therefore, the residual deformation of a column and beam member can be estimated considering the deformation induced by the residual flexural crack widths R f and deformation induced by residual shear crack widths R s , as shown in Eq. (11). As shown in Eqs. (12) and (13), the drift ratio (degree or radian) is used to describe the deformation of a member. Additionally, this study focuses only on the deformation induced by shear cracking.
Figure 1a shows the relationship between the residual flexural crack width and residual deformation. Residual flexural crack widths in the two ends of a member are summed to be ΣW f ; the residual deformation can then be estimated according to the geometric deformation. For convenience, n f is defined here as the ratio between the residual total flexural crack widths ΣW f and the residual maximum flexural crack width W f,max to estimate the deformation incurred from the residual flexural crack, as shown in Eq. (12) (AIJ 1999). Experimental results indicate that the ratio n f of a beam member with the normal-strength RC is around 2.0.
where x n is the distance between the neutral axis and outermost side of the compressive zone, θ is the inclined angle of the shear crack and L is the length of a member (Fig. 1).

Simplified crack-deformation model of column. a Flexural crack. b Shear crack.
The relationship between the residual shear crack widths and residual deformation can be derived using the same concept with the flexural crack (Fig. 1b) (Nakano et al. 2004; Maeda and Kang 2009). In Eq. (13), residual deformation originating from the residual shear crack can be estimated using the ratio n s of the residual maximum shear crack width W s,max to the residual total shear crack widths ΣW s and the residual maximum shear crack width W s,max . Experimental results (Nakano et al. 2004) indicate that the ratio n s of beam members with the normal strength RC is roughly 3–4. However, whether it is applicable to the HSRC beam member warrants further study.
While focusing only on HSRC shear-critical beam and column members, the research conducted by Chiu et al. (2014) investigated the relationship between the residual deformation and the residual shear crack width by conducting a full-size experiment. Based on the crack development of each specimen, the average ratio of the residual total shear crack widths to the residual maximum shear crack width for the HSRC beam specimens is approximately 4.5. Additionally, the ratio of maximum peak shear crack width to residual maximum crack width, it can be increased by shortening stirrup spacing and increasing stirrup strength, and its overall average value is 2.44. However, the experimental results are limited to the shear-span to depth ratio of HSRC members of 3.33. Therefore, for HSRC beams with various shear-span to depth ratios, it is still necessary to derive a formula to describe the relationship between the deformation and maximum shear crack width.
3 Experimental Setup and Results
This section describes the setup for testing the HSRC beam specimens in this study. Ten full-size beam specimens are used to investigate the relationship between crack development and damage state. All tests are performed at the National Center for Research on Earthquake Engineering, Taiwan (NCREE).
3.1 HSRC Shear-Critical Beam Specimens
The AIJ guidelines (2010) used test data obtained under antisymmetric monotonic loading and symmetric monotonic loading to identify the range of stresses that support serviceability and reparability. In the antisymmetric monotonic loading method, the shear-span to depth ratio of the middle region is not easy to estimate owing to the position of the inflection point. In a symmetric monotonic loading test, the mechanical behavior of the equivalent shear region is similar to that of a beam member with a single curvature. Furthermore, it can be assumed to be half of the middle region in the antisymmetric loading test based on the moment and shear distribution diagrams. Zakaria et al. (2009) utilized the symmetric monotonic loading method to study the shear crack behavior of RC beams with shear reinforcement. Therefore, in this study, the symmetric monotonic loading test is utilized to investigate the shear crack behavior. Furthermore, the middle part of a specimen (equivalent moment region) is utilized to investigate simultaneously the flexure crack behavior.
In this study, ten simple-supported beam specimens are tested using the monotonic four-loading method (Fig. 2a). The applied lateral loading is controlled by varying the deformation of the mid-point of each specimen. The shear deformation of a specimen in the equivalent shear region is defined as the ratio of the displacement of the applied loading point to the length of the equivalent shear region (Fig. 2b). The main bars are specified as SD685 of D32, while the stirrups are specified as SD785 of D13. The equivalent shear regions on the right and left-hand sides of the beam specimens are designed with one stirrup spacing (300 mm) except for two specimens, 6W70 and 6H70, with) two stirrup spacings of 200 and 300 mm. The specimens have three lengths [6600 mm (Fig. 2c), 4600 and 2600 mm], and cross-sectional dimensions of 350 mm (width) × 500 mm (depth) and 400 mm (width) × 700 mm (depth) (Fig. 2d). Figure 2d also shows the details of reinforcing steel in the specimens. The shear-span to depth ratios of the specimen are 3.33, 3.25, 2.75, 2.0 and 1.75 in this. The designed thickness of the protective layer is 40 mm, and the measured compressive strength of concrete is approximately 70–100 MPa.

Setup for testing the HSRC beam specimens in this study. a Testing frame for the monotonic four-loading method. b Loading history. c Simple-supported beam specimen with the length of 6600 mm. d Section size of specimen and details of reinforcing steel.
Alone with the compressive strength of concrete and the type of stirrup, the shear-span to depth ratio is a main parameter of the above specimens. The development of shear cracks in HSRC shear-critical beams with various span-to-depth ratios is discussed. The exact effects of these parameters on shear crack development are elucidated. The quantitative relationship between residual crack width and residual deformation is regressed to assess damage to HSRC beam members. Formulas for estimating shear forces that support serviceability and reparability (as described in Sect. 2) are discussed and their application to HSRC beam members is experimentally studied. Tables 1 and 2 list the required structural properties of the beam specimens for mechanical analysis and the mechanical properties of reinforcing steel bars, respectively.
To measure crack development, each specimen is brushed with white cement paint, and 100 × 100 mm grid lines are drawn on it before testing. The actual stirrup position is marked on each specimen. The crack widths are measured using a microscope with a measurement resolution of 0.01 mm. The maximum crack width at a specified peak deformation angle and the residual crack width (with the applied loading set back to zero) at each measurement point are also recorded in the experiment. Additionally, in this study, the crack width measured along the perpendicular direction to the axis of the crack propagation is used to construction the design formulas.
3.2 Experimental Results
Based on the failure mode, the specimens can be divided in two groups, i.e. flexural-shear failure and shear failure (Table 1). In this study, except for the specimens of 6W70 and 6H70, other specimens are concluded as the shear failure according to the experimental observation.
-
(1)
Shear failure
Taking the specimens of 175R70, 200R70, 275R70 and 325R70 for examples (Figs. 3 and 4; cracking point, maximum strength point and degradation point in Fig. 3 are recorded in the experiment), the crack development of each specimen is described as follows. For specimen of 175R70, at the deformation of 0.5 % of the specimen, a shear crack is observed. Up to the deformation of 1.25 %, primary shear cracks occur, whose widths are approximately 1.1 mm in the R-region and 1.0 mm in the L-region. At the deformation of 2 %, the strength reaches the maximum value of 1205.2 kN; the specimen then incurs serious damage along the primary shear crack in the L-region and, suddenly, the strength decreases to 1028.5 (85.3 % of the maximum strength). In the final step with a deformation of 4 %, the strength decreases to 563.6 kN (46.8 % of the maximum strength), owing to the crushing of most of the concrete in the strut area. The experiment is then stopped. The similar failure mode and crack development can be found in the specimen 200R70.
Fig. 3 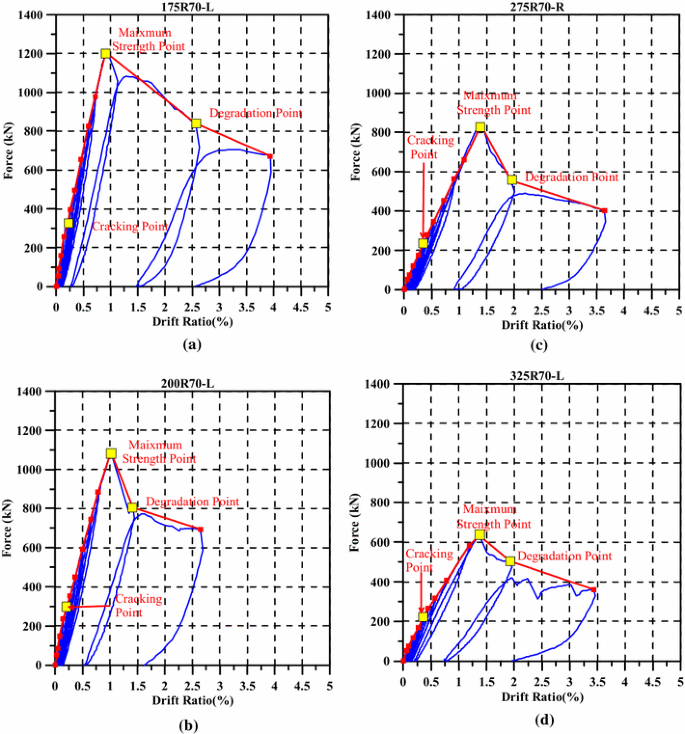
Force-displacement curves of the specimens (175R70, 200R70, 275R70 and 325R70). a 175R70-L. b 200R70-L. c 275R70-R. d 325R70-L.
Fig. 4 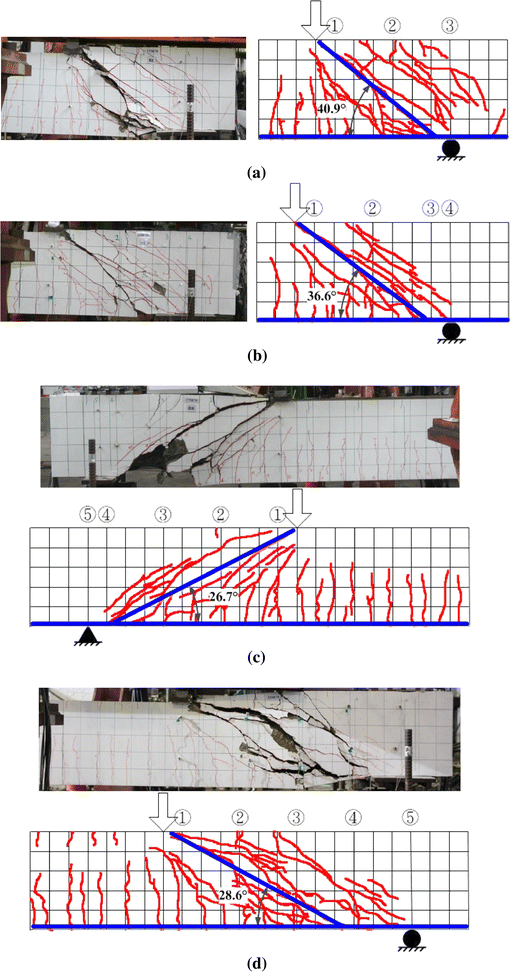
Crack development of the specimens (175R70, 200R70, 275R70 and 325R70). a 175R70-L. b 200R70-L. c 275R70-R. d 325R70-L.
For specimen of 275R70, a shear crack forms at a deformation of 0.30 %. Up to the deformation 1.25 %, the primary shear cracks occur, whose widths are approximately 1.1 mm in the R-region and 0.9 mm in the L-region. The strength researches the maximum value of 837.1 kN at the deformation 2 %; then, the specimen has serious damage along the primary shear crack in the R-region and suddenly the strength decreases to 556.3 (66.5 % of the maximum strength). In the final step with a deformation of 3 %, the strength decreases to 402.2 kN (48.1 % of the maximum strength) due to the most of concrete near the support area spalls and then the experiment is stopped.
For specimen of 325R70, at the deformation of 0.5 % of the specimen, a shear crack is observed. Up to the deformation 1.5 %, the primary shear cracks occur, whose widths are approximately 1.62 mm in the R-region and 1.4 mm in the L-region. The strength researches the maximum value of 634.2 kN at the deformation 2 %; then, the specimen has serious damage along the primary shear crack in the L-region and suddenly the strength decreases to 505.1 (79.6 % of the maximum strength). Additionally, the crack also extends along main bars to the support horizontally in the L-region. In the final step with a deformation of 3 %, the strength decreases to 361.1 kN (56.9 % of the maximum strength) due to the most of concrete in the compression zone crushes (shear-compression failure) and then the experiment is stopped.
-
(2)
Flexural-shear failure mode
Since the equivalent shear regions on the right and left-hand sides of the beam specimens were designed with two stirrup spacings, named as L-20 and R-30 regions, the hysteresis loops and envelope lines were drawn for the critical region in one specimen, respectively.
-
(a)
Specimen of 6W70 (power ring type)
When the applied displacement induces a deformation of 6W70 of 0.1 %, flexural cracks form in the L-20 and R-30 regions. A shear crack forms at a deformation of 0.375 %. As the applied displacement increases, many cracks form in the two regions. The primary shear crack with a width of 1.5 mm forms in the R-30 region of the specimen at a deformation of 1.5 %. At a deformation of 2.00 %, a shear force reaches the maximum point of 913.1 kN. When the deformation reaches 3.0 %, the primary shear crack in the R-30 region of the specimen extends up the compression zone of concrete and extends horizontally along the main bars to the support. Accordingly, the compression zone of concrete crushes and the compressive reinforcement buckles, causing the specimen to lose strength suddenly; then, the applied loading suddenly falls from the maximum strength of 906.5–728.4 kN (79.8 % of the maximum strength) (Fig. 5). The primary shear crack also extends along main bars to the support horizontally. At the last applied displacement, the specimen’s strength decreases to 699.7 kN (76.6 % of the maximum strength) and its failure can be concluded to the shear-compression failure. Figure 6 shows the crack development and failure in the right side of the specimen of 6W70, respectively.
Fig. 5 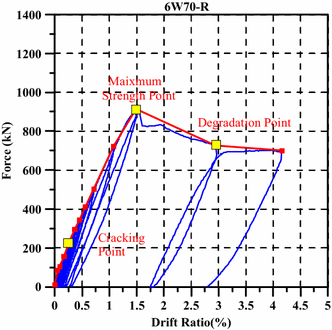
Force–displacement curves of the specimen 6W70 (R-region, s = 300 mm).
Fig. 6 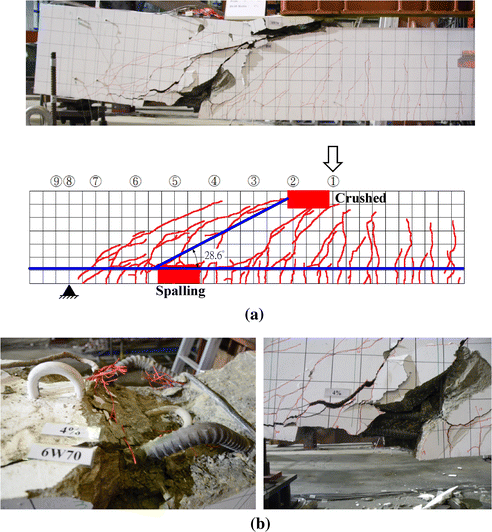
Failure of the specimen of 6W70. a Crack development in the right side of the specimen. b Critical failure points in the right side of the specimen.
-
(b)
Specimen of 6H70 (135° tied type)
When the applied displacement induces a deformation of 6H70 of 0.1 %, flexural cracks form in the L-20 and R-30 regions. A shear crack forms at a deformation of 0.375 %. As the applied displacement increases, many cracks form in the two regions. The primary shear crack with a width of 1.03 mm forms in the R-30 region of the specimen at a deformation of 1.0 %. At a deformation of 3.00 %, a shear force reaches the maximum point of 1047.9 kN. When the deformation reaches 4.0 %, the compression zone of concrete crushes and the concrete cover in the compression zone also spalls; then, the applied loading suddenly falls from the maximum strength of 1039.9–628.1 kN (59.9 % of the maximum strength) (Fig. 7). However, the failure mode is not the shear failure in the equivalent shear zone; the experimental data still can be used to investigate the shear crack development of the specimen of 6H70. Figure 8 shows the crack development and failure in the right side of the specimen of 6H70, respectively.
Fig. 7 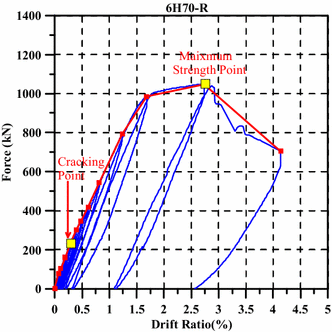
Force–displacement curve of the specimen 6H70 (R-region, s = 300 mm).
Fig. 8 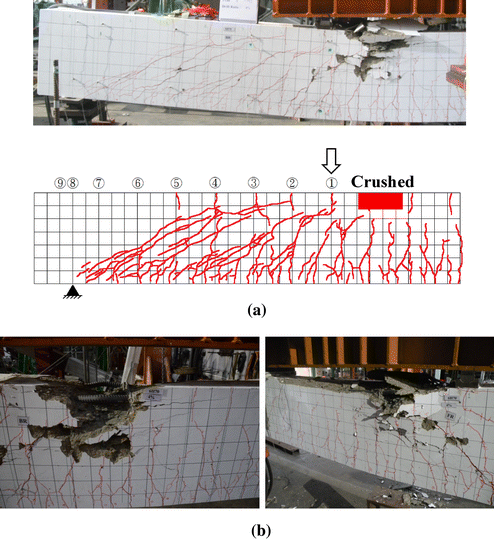
Failure of the specimen of 6H70. a Crack development in the right side of the specimen. b Critical failure points of the specimen 6H70.
-
(a)


4 Experimental Results and Discussion
This section concerns the development of shear cracks in HSRC shear-critical beams, based on the experimental results of this study. The shear crack strength and the design formulas for controlling the maximum width of the shear crack, and the relationship between the width of the shear crack and the deformation of a beam is quantified.
4.1 Shear Crack Strength of Concrete
According to Chiu et al. (2014), stresses that are calculated using Eqs. (1) and (3) exceed measured stresses. Restated, Eqs. (1) and (3) provide unconservative predictions of the shear crack strength of HSRC beam specimens. Equation (3) is derived from fracture theory and modified using experimental data, while Eq. (1) is based only on experimental data. Nakano et al. (2004) demonstrated the feasibility of applying Eq. (3) to HSC. Subsequently, Chiu et al. (2014) suggested a modification factor of 0.35 (rather than the original modification factor of 0.51) for use in Eq. (3) for the shear crack strength of the HSRC beam specimens. However, since the shear-span to depth ratio was not a variable in the experiment of Chiu et al. (2014), the suggested modification factor should be verified with consideration of the effect of the shear-span to depth ratio.
In this study, the shear force that corresponds to the peak deformation angle at which the first shear crack is observed in the testing process is defined as the shear crack force of a concrete specimen. Since the specimens have various dimensions, the shear crack force is divided by the effective cross-sectional area to obtain the shear crack stress or strength. The specimens designed in this study can be classified into full-size specimens. Therefore, this work doesn’t investigate the size effect on the shear crack propagation. According to the results herein, the shear crack strength v cr varies with the shear-span to depth ratio. Based on the results of Chiu et al. (2014) and the data herein, a regression analysis is performed to obtain the modification factor \( \phi \), including the shear-span to depth ratio effect in Eq. (14).
According to Fig. 9, when the compressive strength of concrete is 70 MPa or 100 MPa, the proposed formula (Eq. (14)) accurately reflects the effect of the shear-span to depth ratio on the shear crack strength of concrete for HSRC specimens. Additionally, Eq. (14) is more accurate for all specimens than the prediction equation that was provided by AIJ (1999, 2010).

Proposed formula for the shear crack strength concrete. a \( f_{c}^{\prime} = 70 {\,\text{MPa}} \). b \( f_{c}^{\prime} = 100 {\,\text{MPa}} \).
4.2 Ultimate Shear Strength of Concrete
The shear force that is exerted by the stirrup is subtracted from the ultimate shear force of the specimen that is obtained from testing to obtain the ultimate shear strength of concrete. The primary shear crack of the specimen passes through the stirrups. Their corresponding stresses are then estimated using the strain values that are measured using strain gauges. Next, the forces that are exerted by various stirrups are summed to obtain the shear forces that are exerted by the stirrups.
According to Fig. 10a, the ultimate shear strength of concrete increases as the shear-span to depth ratio decreases. Also, the recommended values of various specifications become increasingly conservative as the shear-span to depth ratio of specimen declines. Clearly, ACI 318 (2011) and AIJ (1999) underestimate the ultimate shear strengths of concrete of the specimens, except for those with a shear-span to depth ratio of 3.33. JSCE (2007) evaluates the ultimate shear strength of concrete by using the shear-compression failure mechanism, explaining why it is more accurate than the equations of other specifications.

Proposed formula for the ultimate shear strength of concrete. a Recommended values of various specifications. b \( f_{c}^{\prime} = 70 {\,\text{MPa}} \). c \( f_{c}^{\prime} = 100 {\,\text{MPa}} \).
This study examines the relationship between the experimental values and \( \sqrt {f_{c}^{{\prime }} } \) for specimens with a shear-span to depth ratio of 3.25 and testing results of the reference. We recommend strength-modified coefficient of Eq. (16) of 0.45. Based on the results of tests on specimens with shear-span to depth ratios of 1.75–2.75, this study also determines the modification coefficient α of the shear-span to depth ratio in Eq. (17). The recommended equation for the ultimate shear strength of concrete v cu considers the effect of the shear-span to depth ratio to provide good forecasting results with a compressive strength of concrete herein of 70 or 100 MPa (Figs. 10b and 10c).
4.3 Relationship Between Deformation of Member and Widths of Cracks
Generally, obtaining information about cracks in a member under an earthquake by performing a dynamic history analysis or using nonlinear static analysis to obtain directly the performance or damage state of members is not easy. Therefore, this study constructs the relationship between crack widths and the deformation of a member from the experimental results, to help engineers determine the performance or damage state of members under an earthquake. To elucidate the relationship between shear crack widths and the deformation of a member, this sections discusses the ratio of total shear crack width to maximum shear crack width at the peak deformation angle of a member (n s_Peak ), the ratio of the residual total shear crack width to the residual maximum shear crack width (n s_Residual ) and the ratio of the peak maximum shear crack width to the residual maximum shear crack width (n s_Maximum ). In the experiment, total shear crack width is defined as the summation of widths of all shear cracks that are observed in one equivalent shear force region of a specimen while the largest shear crack width of all shear cracks is defined as the maximum shear crack width. Furthermore, the effects of the shear-span to depth ratio on these ratios are also studied. According to the research conducted by Chiu et al. (2014), n s_Peak and n s_Residual increase with the shear deformation of member increasing and trend to be a constant after the stirrup yielding; therefore, on the basis of the experimental results, the shear deformation and residual shear deformation corresponding the stirrup yielding are set as 0.67 and 0.14 %, respectively, in this study. Additionally, for one shear-span to depth ratio, this study uses the average value of crack width ratios under two various compression strengths of concrete to investigate the relationship between the crack width ratio and shear-span to depth ratio.
The shear deformation of 0.67 % is utilized as a reference point in determining the relationships between n s_Peak and the shear deformation under various shear-span to depth ratios. Figure 11a demonstrates that n s_Peak is in the range of 1.74–4.13 and increases with the shear-span to depth ratio. Based on the experimental results in Fig. 11a, the regression equation, Eq. (19), is recommended to describe the relationship between total shear crack width and the maximum shear crack width at the peak deformation angle of the member.

Relationship between crack widths and deformation of member under various shear-span to depth ratios. a Relationship between total shear crack widths and the maximum shear crack width at the peak deformation of member. b Relationship between residual total shear crack widths and the residual maximum shear crack width at the residual deformation of member. c Relationship between the maximum shear crack width and the residual maximum shear crack width at the peak deformation of member.
The residual shear deformation of 0.14 % is utilized as the reference point to elucidate the relationship between n s_Residual and the residual shear deformation under various shear-span to depth ratios. Figure 11b demonstrates that n s_Residual is 1.7–3.0 and increases with the shear-span to depth ratio. Based on the experimental results in Fig. 11b, the regression equation, Eq. (20), is recommended to elucidate the relationship between residual total shear crack width and the residual maximum shear crack width under the residual deformation of a member.
With respect to the ratio of the maximum shear crack width to the residual maximum shear crack width at the peak deformation angle, Fig. 11c demonstrates that n s_Maximum declines as the shear-span to depth ratio increases. Based on the experimental results in Fig. 11c, we recommend that the regression equation Eq. (21) should be used to elucidate the relationship between the maximum shear crack width and the residual maximum shear crack width at the peak deformation angle of the member. Based on the experimental results in Fig. 12, the angle of the primary shear crack is regressed as Eq. (22), which is required to estimate the shear deformation of each specimen.

The angle of the primary shear crack under various shear-span to depth ratios.
Based on Eqs. (14), (19), (21) and (22), the maximum residual shear crack width can be used to estimate the corresponding peak shear deformation of each specimen, as presented in Fig. 13. Figure 13 shows only the equivalent shear region of each specimen that has large shear deformation. Clearly, the proposed Eqs. (19) and (21) use the residual maximum shear crack widths to provide a conservative prediction of the corresponding peak shear deformation of each specimen.


Predicted peak shear deformations of each specimen using the maximum residual shear crack widths. a 175R70. b 175R100. c 200R70. d 200R100. e 275R70. f 275R100. g 325R70. h 325R100. i 6H70. j 6W70.
4.4 Relationship Between Shear Crack Width and Stress of Stirrup
Based on the experimental results, this study also investigates the relationship between the strain of the stirrup and the peak maximum shear crack for each shear-span to depth ratio. The yielding strain of the stirrup that corresponds to the peak maximum shear crack width is then regressed linearly. When the stirrup yields, the peak maximum shear crack width ranges from 0.93 to 1.22 mm, suggesting that the shear-span to depth ratio only slightly affects the relationship between the yielding strain of the stirrup and the peak maximum shear crack width. Additionally, when the peak maximum shear crack width is limited to 0.3 mm, the allowable strain of stirrup ranges from 0.25 to 0.33 times the yielding strain of the stirrup; when the peak maximum shear crack width is limited to 1.0 mm, the allowable strain of stirrup ranges from 0.82 to 1.09 times the yielding strain of the stirrup.
Figure 14a demonstrates that regression curve of the allowable shear stress of concrete that corresponds to the peak maximum shear crack width of 0.3 mm is almost consistent with the regression curve of concrete crack shear stress. Restated, the shear cracking of concrete to a peak maximum shear crack width of 0.3 mm contributes only slightly to the shear stress of concrete Therefore, (we recommend that the shear crack strength of concrete is the allowable shear stress of concrete to ensure serviceability (peak maximum shear crack width ≤0.3 mm). According to Fig. 14b, the allowable shear stress of concrete that (corresponds to the peak maximum shear crack width of 1.0 mm is 0.6–1.0 times higher than the ultimate shear strength of concrete. For convenience in engineering, we recommend that concrete should have an allowable shear stress that is 0.6 times higher than its ultimate shear strength to ensure reparability (peak maximum shear crack width ≤1.0 mm), as mentioned in Sect. 4.2.

Proposed allowable shear stresses corresponding to specified shear crack widths. a Shear crack width of 0.3 mm. b Shear crack width of 1.0 mm.
According to previous research (Chiu et al. 2014), the peak maximum shear crack width and the residual maximum shear crack width can be reduced by reducing the stirrup spacing, increasing the stirrup strength, and increasing the tensile reinforcement ratio. The tensile reinforcement ratio has the weakest effect on peak maximum shear crack width. Therefore, in this study, the shear crack strength, stirrup ratio and shear-span to -depth ratio are utilized to derive the relationship between the sectional average shear force and the maximum shear crack width. A situation in which the sectional average shear forces are normalized to the shear crack strength and the peak maximum shear crack widths are normalized to the effective depth of the section and stirrup ratio of a specimen, respectively, suggests that the two dimensionless quantities have a linear tendency in the logarithmic axes (Fig. 15). According to the regression results in Fig. 15, the relationship between shear force on a section and maximum shear crack width can be obtained by considering one standard deviation of error values (Eq. (23)). Accordingly, this study elucidates allowable stirrup stress. Next, consider for example a maximum shear crack width of 0.3 mm and a variable stirrup ratio; the section shear force is estimated using Eq. (23), and the stress that is contributed the stirrup is obtained given by Eq. (24). According to Fig. 16, the stirrup stress is approximately 98.8 MPa which is 0.125 times higher than the specified yield stress of the stirrup. Obviously, Fig. 16 shows the allowable stress obtained from the linear regression is a conservative value for the shear crack width control. If the crack width of 0.4 mm, as required by ACI 318 (2011) to control the flexural crack, is utilized to ensure serviceability, then the corresponding allowable stirrup stress can be set to 113.0 MPa which is 0.15 times higher than the specified yield stress of the stirrup.

Relationship between the sectional shear forces and peak maximum shear crack widths.

Relationship between the allowable stress of stirrup and stirrup ratio.
The allowable stirrup stress that the guarantees repair performance is based on the assumption that the residual maximum shear crack of a component following an earthquake does not exceed 0.4 mm. However, since it is not easy to unload the force to be the long-term loading in the experiment, the allowable stresses of concrete and reinforcement that ensure reparability cannot be directly determined. According to the recommendation in Sect. 4.3, the ratio of the maximum shear crack width to the residual maximum shear crack width at the peak deformation angle can be estimated using Eq. (21). If a ratio of 2.5 is used, then the maximum shear crack width at the peak deformation angle is calculated to be approximately 1.0 mm. Therefore, under the condition that a maximum shear crack width of 1.0 mm is the control objective, the allowable stirrup stress can be set to 162.9 MPa which is 0.20 times higher than the specified yield stress of the stirrup.
4.5 Crack-Controlled Design Formulas for Ensuring Serviceability and Reparability
To ensure the serviceability of an HSRC beam member, we recommend that the peak maximum shear crack width should not exceed 0.4 mm under long-term loading. To ensure the reparability of an HSRC beam member in a medium-magnitude earthquake, the residual maximum shear crack width must be less than 0.4 mm corresponding to a peak maximum shear crack width of 1.0 mm, as indicated in Sect. 2. Based on the experimental results, the allowable stress values of concrete and reinforcement are obtained herein to ensure serviceability and reparability. Their corresponding design formulas are derived (Table 3).
5 Conclusions
In this study, ten full-size simple-supported beam specimens with high-strength reinforcing steel bars (SD685 and SD785) are tested using the four-point loading. The measured compressive strength of the concrete is in the range of 70–100 MPa and the shear-span to depth ratio is in the range of 1.75–3.33. Based on the analysis and discussion of the limited experimental data in this study, the following conclusions are drawn as follows:
-
1.
Shear crack strength of concrete Based on experimental data, in the calculation of the shear crack strength of HSRC beam specimens, this study suggests a modification factor (Eq. (15)), which can accounts for the effect of the shear-span to depth ratio of a beam, for Eq. (14) (original modification factor for normal-strength RC beam or column is 0.51).
-
2.
Ultimate shear strength of concrete This study uses the results of tests on specimens to determine the modification coefficient of the shear-span to depth ratio (Eq. (18)) for use in Eq. (17). The recommended equation for the ultimate shear strength of concrete in this study considers the effect of the shear-span to depth ratio to provide accurate forecasting results.
-
3.
Relationship between shear crack widths and deformation of member To determine the relationship between shear crack widths and the deformation of a member, three items are considered; they are the ratio of total shear crack width to the maximum shear crack width at the peak deformation angle of the member (n s_Peak ), the ratio of residual total shear crack width to the residual maximum shear crack width (n s_Residual ), and the ratio of the peak maximum shear crack width to the residual maximum shear crack width (n s_Maximum ). The effects of the shear-span to depth ratio on these ratios are also studied, and given by Eqs. (19), (20) and (21).
-
4.
Crack-controlled design formula To ensure the serviceability of an HSRC beam member, the peak maximum shear crack width must be kept under 0.4 mm under long-term loading. Additionally, to ensure the reparability of an HSRC beam member in a medium-magnitude earthquake, the residual maximum shear crack width must be kept under 0.4 mm (corresponding to a peak maximum shear crack width of 1.0 mm). This study provides experimental results that are used to quantify the allowable stresses of concrete and reinforcement that ensure serviceability and reparability and proposes their corresponding design formulas, as listed in Table 3.
Abbreviations
- p w :
-
The stirrup ratio (\( = \displaystyle\frac{{a_{w} }}{bs} \))
- a w :
-
The section area of stirrup in the range of stirrup spacing (mm2)
- s :
-
The space of stirrup (mm)
- f cs :
-
The long-term allowable shear stress of concrete (MPa)
- f ss :
-
The long-term allowable tensile stress of stirrup (MPa)
- α :
-
The modification factor of the span-depth ratio [\( = \displaystyle\frac{4}{{\frac{M}{Vd} + 1}} (1 \le {{\alpha}} \le 2) \) in Eqs. (1) and (2)]
- M :
-
The maximum moment in the long-term loading of a member (N-mm)
- V AL1 :
-
The allowable shear force in the long-term loading of a member (N)
- b :
-
The width of a cross-section (mm)
- j :
-
The distance between the centroids of compressive and tensile steels (mm)
- d :
-
The effective depth of a cross-section (mm)
- \( h \) :
-
The depth of a cross section (mm)
- V sc :
-
The shear crack force of concrete of a member (N)
- \( \phi \) :
-
The modification factor [=0.51 in Eq. (3)]
- \( \kappa \) :
-
The shape factor [=1.5 for rectangular section in Eq. (3)]
- f t :
-
The tensile strength of reinforced concrete [=0.33\( \sqrt {f_{c}^{\prime} } \) in Eq. (3)] (MPa)
- f o :
-
The applied axial stress (MPa)
- f c :
-
The short-term allowable shear stress (MPa)
- f s :
-
The short-term allowable tensile stress (MPa)
- v c :
-
The ultimate shear strength of concrete suggested in ACI 318 (2011) (MPa)
- \( f_{c}^{\prime} \) :
-
The compression strength of concrete (MPa)
- \( \rho_{w} \) :
-
The ratio of A s to b w d
- A s :
-
The total sectional area of nonprestressed tension reinforcement (mm2)
- b w :
-
The width of web of a beam (mm)
- V u :
-
The design shear force of a member (N)
- M u :
-
The design moment of a member (N-mm)
- v cd :
-
The ultimate shear strength of concrete suggested in JSCE (2007) (shear-tension failure mode) (MPa)
- v dd :
-
The ultimate shear strength of concrete suggested in JSCE (2007) (shear-compression failure mode) (MPa)
- β d :
-
The parameter related to the depth of a member
- β p :
-
The parameter related to the main bar ratio
- β n :
-
The parameter of the axial force of a member
- β a :
-
The parameter related to the shear-span to depth ratio of a member
- γ b :
-
The modification factor of member [=1.3 in Eqs. (7) and (9)]
- R f :
-
The deformation induced by the residual flexural crack widths
- R s :
-
The deformation induced by residual shear crack widths
- ΣW f :
-
The summation of residual flexural crack widths in the two ends of a member (mm)
- W f,max :
-
The residual maximum flexural crack width (mm)
- n f :
-
The ratio between the residual total flexural crack widths ΣW f and the residual maximum flexural crack width W f,max
- x n :
-
The distance between the neutral axis and outermost side of the compressive zone (mm)
- D :
-
The depth of a cross-section (mm)
- θ :
-
The inclined angle of the shear crack (degree or radian)
- L :
-
The length of a member (mm)
- W s,max :
-
The residual maximum shear crack width (mm)
- ΣW s :
-
The residual total shear crack widths (mm)
- n s :
-
The ratio of the residual maximum shear crack width W s,max to the residual total shear crack widths ΣW s
- v cr :
-
The shear crack strength of concrete proposed in this study (MPa)
- a/d :
-
The shear-span to depth ratio of a member
- v cu :
-
The ultimate shear strength of concrete proposed in this study (MPa)
- n s_Peak :
-
The ratio of total shear crack width to maximum shear crack width at the peak deformation angle of a member
- n s_Residual :
-
The ratio of the residual total shear crack width to the residual maximum shear crack width
- n s_Maximum :
-
The ratio of the peak maximum shear crack width to the residual maximum shear crack width
References
ACI. (2010). Report on high-strength concrete. ACI Committee 363. Farmington Hills, MI: American Concrete Institute.
ACI. (2011). Building code requirements for structural concrete. ACI Committee 318. Farmington Hills, MI: American Concrete Institute.
AIJ. (1999). Design guidelines for earthquake resistant reinforced concrete buildings based on inelastic displacement concept. Tokyo, Japan: Architectural Institute of Japan. (in Japanese).
AIJ. (2010). Standard for structural calculation of reinforced concrete structures. Tokyo, Japan: Architectural Institute of Japan.
Chiu, C. K., Chi, K. N., & Lin, F. C. (2014). Experimental investigation on the shear crack development of shear-critical high-strength reinforced concrete beams. Journal of Advanced Concrete Technology, 12(7), 223–238.
FIP/CEB. (1990). High strength concrete, State of the art report. Bulletin d’Information No. 197, August 1990.
JSCE. (2007). Standard specifications for concrete structure “design”. Tokyo, Japan: Japan Society of Civil Engineers.
Maeda, M., & Kang, D. E. (2009). Post-earthquake damage evaluation for reinforced concrete buildings. Journal of Advanced Concrete Technology, 7(3), 327–335.
Nakano, Y., Maeda, M., Kuramoto, H., & Murakami, M. (2004). Guideline for post-earthquake damage evaluation and rehabilitation of RC buildings in Japan. In 13th World Conference on Earthquake Engineering, Vancouver, Canada (Paper No. 124).
Shimazaki, K. (2009). Evaluation of shear crack width based on shear force ratio. AIJ Journal of Technology and Design, 15(29), 139–142. (in Japanese).
Silva, S. D., Mutsuyoshi, H., & Witchukreangkrai, E. (2008). Evaluation of shear crack width in I-shaped prestressed reinforced concrete beams. Journal of Advanced Concrete Technology, 6(3), 443–458.
Soltani, A., Harries, K. A., & Shahrooz, B. M. (2013). Crack opening behavior of concrete reinforced with high strength reinforcing steel. International Journal of Concrete Structures and Materials, 7(4), 253–264.
Zakaria, M., Ueda, T., Wu, Z., & Liang, M. (2009). Experimental investigation on shear cracking behavior in reinforced concrete beams with shear reinforcement. Journal of Advanced Concrete Technology, 7(1), 79–96.
Author information
Authors and Affiliations
Corresponding author
Rights and permissions
Open Access This article is distributed under the terms of the Creative Commons Attribution 4.0 International License (http://creativecommons.org/licenses/by/4.0/), which permits unrestricted use, distribution, and reproduction in any medium, provided you give appropriate credit to the original author(s) and the source, provide a link to the Creative Commons license, and indicate if changes were made.
About this article

Cite this article
Chiu, CK., Ueda, T., Chi, KN. et al. Shear Crack Control for High Strength Reinforced Concrete Beams Considering the Effect of Shear-Span to Depth Ratio of Member. Int J Concr Struct Mater 10, 407–424 (2016). https://doi.org/10.1007/s40069-016-0161-8
Received:
Accepted:
Published:
Issue Date:
DOI: https://doi.org/10.1007/s40069-016-0161-8