- Open access
- Published:
Analytical Study of Force–Displacement Behavior and Ductility of Self-centering Segmental Concrete Columns
International Journal of Concrete Structures and Materials volume 11, pages 489–511 (2017)
Abstract
In this study the behavior of unbonded post-tensioned segmental columns (UPTSCs) was investigated and expressions were proposed to estimate their ductility and neutral axis (NA) depth at ultimate strength. An analytical method was first employed to predict the lateral force–displacement, and its accuracy was verified against experimental results of eight columns. Two stages of parametric study were then performed to investigate the effect of different parameters on the behavior of such columns, including concrete compressive strength, axial stress ratio, diameter and height of the column, axial stress level, duct size, stress ratio of the PT bars, and thickness and ultimate tensile strain of fiber reinforced polymer wraps. It was found that the column’s aspect ratio and axial stress ratio were the most influential factors contributing to the ductility, and axial stress ratio and column diameter were the main factors contributing to the NA depth of self-centering columns. While at aspect ratios of less than ten, as the axial stress ratio increased, the ductility increased; at aspect ratios higher than ten, the ductility tended to decrease when the axial stress ratio increased. Using the results of parametric study, nonlinear multivariate regression analyses were performed and new expressions were developed to predict the ductility and NA depth of UPTSCs.
1 Introduction
In the recent past considerable attention has been given to the use of self-centering precast concrete members and connections (Priestley et al. 1999; Kurama et al. 2002; Perez et al. 2007; Kim and Choi 2015) and bridge construction (Dawood et al. 2011; Kwan and Billington 2003; Youssf et al. 2015a, 2016; Kim et al. 2012; Kim 2013). Self-centering behavior can be induced to the system by employing unbonded post-tensioning (PT) steel. In these systems the residual drifts and the damage to the structure in seismic events are limited, resulting in reduced cost associated with structural repair and business downtime (Hassanli et al. 2016a). Self-centering concrete systems can display a ductile response and carry high levels of lateral loads (Henry 2011).
The conventional methods used to determine the lateral strength of concrete columns cannot be applied to self-centering columns due to the increase in the PT force that results in variable axial load. Moreover, strain compatibility is not a correct assumption for these columns (ElGawady et al. 2010; ElGawady 2011). As a result of the rotation of the columns at their base, deformations of self-centering columns are mainly due to the rocking mechanism (Wight et al. 2007). This rocking mechanism leads to variation in the level of axial stress at different drift ratios and hence the lateral load behavior of the columns. The lateral displacement of the self-centering columns also consists of elastic flexural deformation, shear deformation and relative movement of segments due to sliding. Deformation due to shear and sliding are usually ignored, however they might be significant in columns with low aspect ratios (Priestley et al. 1996a).
Recently, segmental precast concrete members have become a subject of interest. In segmental systems with PT bars/tendons, the PT force works as the clamping force which keeps the segments together. Unbonded post-tensioned segmental columns (UPTSCs) can be used in bridge structures to reduce construction times and improve structural quality. Monotonic, cyclic and dynamic behavior of these columns have been studied experimentally by many researchers (Chang et al. 2002; Chou and Chen 2006; Marriott et al. 2009; Yamashita and Sanders 2009; Wang et al. 2008; Shim et al. 2008; Bu et al. 2015). While UPTSCs are capable of withstanding large nonlinear displacement, due to their low level of damage under seismic excitation, they experience large displacements. To tackle this drawback, different approaches have been developed to increase the energy dissipation capacity of the rocking columns, including the use of metallic yielding components (ElGawady 2011; Ou et al. 2009, 2010), shape memory alloy bars (Roh and Reinhorn 2010; Roh et al. 2012), external energy dissipating dampers (Palermo et al. 2007) and columns with cast-in-place (emulative) base (Kim et al. 2015; Ou et al. 2013). To improve the behavior self-centering precast members the effect of using confinement jackets (Motaref et al. 2013; Hewes and Priestley 2002), fiber-reinforced concrete (Shajil et al. 2016), and rubber or elastomeric bearing pads (ElGawady 2011; Motaref et al. 2010) have also been investigated.
Research undertaken on the analytical approach to predict the behavior of UPTSCs is limited. Hewes and Priestley (2002) proposed a simplified analytical model to predict the lateral force- displacement relationship. Ou et al. (2007) extended the approach to hybrid UPTSCs (with longitudinal mild steel across the segments’ joints), and using a modified curvature to account for the effect of mild steel, they showed the accuracy of the method for hybrid UPTSCs. Palermo et al. (2007) showed that a similar design procedure considering lumped plasticity models can be used to design and model hybrid bridge structures. Chou et al. (2013) considered two plastic hinges to account for the joint opening between the column and its base as well as between the first two column segments and demonstrated that their model is capable of predicting pushover responses of UPTSCs.
Three dimensional finite element (FE) modeling has been performed to predict the force–displacement behavior of UPTSCs (Dawood et al. 2011; Ou et al. 2007; Chou et al. 2013; Sideris 2015; Youssf et al. 2015b). Ou et al. (2007) demonstrated that three dimensional FE modeling can be used to effectively predict the lateral response of UPTSCs. Chou et al. (2013) and Kim et al. (2010) showed that two dimensional FE modeling can also predict the force–displacement behavior response of UPTSCs.
Using experimental results of eight columns, this paper evaluates the accuracy of an analytical approach to predict the behavior of UPTSCs. The concept of the analytical method was similar to previous studies (Hewes and Priestley 2002; Ou et al. 2007; Pampanin et al. 2001); however, the displacement at the column top was considered as the independent variable rather than the curvature at the base of column. Moreover, the plastic hinge length expression proposed by Hassanli et al. (2017) was considered. Stress–strain relationships for un-confined and FRP-confined concrete, proposed respectively by Kent and Park (1971) and Lam and Teng (2003), were adopted. The analytical approach was developed based on the mechanics of rocking of columns about their base and geometric compatibility conditions. In this approach the column rotation was assumed to occur only at the column base.
Using the validated analytical approach, Stage I of a parametric study consisting of 43 columns was performed to investigate the effect of different parameters on the behavior of self-centering columns, including concrete compressive strength, axial stress ratio, diameter and height of the column, axial stress level, duct size, stress ratio of the PT bars, and the thickness and ultimate tensile strain of fiber reinforced polymer (FRP) wraps. The results of Stage I of the parametric study were then used to generate the configuration of the columns for Stage II of the parametric study. The ductility of the columns was then calculated and nonlinear multivariate regression analysis was performed to develop an expression to estimate the ductility of UPTSCs.
2 Analytical Approach
The conventional strain compatibility method to determine the lateral strength of concrete columns is not appropriate for unbonded PT specimens (Hewes and Priestley 2002; Bu and Ou 2013), as explained in the introduction section. Hassanli et al. (2017) developed an expression to predict the plastic hinge length of masonry walls and incorporated it with a step-by-step analytical procedure (Hassanli 2015). The analytical method they developed could effectively predict the lateral behavior of the masonry walls. Hassanli et al. (2016a) applied the procedure to concrete walls and showed that it could accurately predict their lateral force behavior. In this study the same procedure was considered, however, it was modified to be appropriate for column members. The steps of the analytical approach were as follows:
2.1 Force–Displacement Response at Decompression Point
The stress distribution over the cross section at the decompression point is illustrated in Fig. 1. In the rocking walls before the decompression point, as the whole cross section is in compression, no elongation of the PT tendons/bar and hence no increase in the PT force occurs (Hassanli et al. 2016a, b). By taking moments about the column toe, the base shear corresponding to the decompression point can be calculated as:
where r is the radius and half of the length of the cross section in a circular and rectangular cross sections, respectively, N is the gravity load including the self-weight of the column, \( f_{se } \) is the initial stress in the pre-stressing steel after immediate losses, \( A_{ps } \) is the pre-stressing steel area, \( h_{c} \) is the column height, \( c_{c0} \) is the total compression force in concrete at the decompression point and \( \bar{X} \) is the corresponding lever arm. \( c_{c0} \) can be calculated as (Fig. 1),
where \( f_{co } (x) \) and \( b(x) \) are respectively the concrete stress and width of the element at distance x from the column heel, see Fig. 1. The maximum compressive stress in the concrete at the decompression point at the column toe, \( f_{co } \), is usually a small value and a linear stress–strain relationship can be considered before the decompression point (Hassanli et al. 2016a). Therefore, the compression stress at distance x from the column heel can be expressed as,
where \( \varepsilon_{0} \) is the maximum compressive strain in the concrete at the decompression point and \( E_{c} \) is the concrete elastic modulus. Considering a triangular distribution of compressive stress on the cross section (Fig. 1), the \( \varepsilon_{0} \) can be determined as,
Using Eqs. 2 and 3, the values of \( c_{c0} \) and \( \bar{X} \) were calculated for rectangular and circular cross sections and are presented in Appendix.

Stress distribution of a typical element at the decompression point.
Assuming a linear curvature variation along the height of the column and by integrating the curvature function along the height, the lateral displacement at the column top at the decompression point is (Priestley et al. 2007):
where \( \varphi_{0} \) is the maximum wall curvature at decompression point,
Using Eqs. 1 and 6 a point of the force displacement response corresponding to the decompression point, \( \Delta_{0} \),\( V_{0} \), can be determined.
2.2 Force–Displacement Response Beyond Decompression Point
The stress increment in the PT steel beyond the decompression point needs to be taken into account. Considering a rocking mechanism (Fig. 2) and assuming that the entire rotation of the column occurs at the base, to determine the force–displacement response of UPTSCs, the following iterative procedure needs to be undertaken: (note that assuming the entire rotation of the column occurs at the column footing interface is reasonable if the column segments are similar and the same column to footing connection is used between the column segments. In other cases such as in hybrid columns where the energy dissipation devices do not extend to the top segments, the possibility of gap opening between the column segments should also be considered)

Column deformation.
-
1.
Assume a top displacement of Δ (due to rocking) and calculate the corresponding column rotation, θ (Fig. 2) (θ = Δ/h c ).
-
2.
Assume a value of neutral axis (NA) depth, c (Fig. 2).
-
3.
Calculate the strain in the PT steel, \( \varepsilon_{ps} \), using Eq. 8.
$$ \varepsilon_{ps} = \theta (r - c)/l_{ps} + \varepsilon_{se} $$(8)where \( l_{ps} \) is the unbonded length of the PT steel and \( \varepsilon_{se} \) is the effective strain in the PT steel after immediate stress losses. Equation 8 implies that the strain in the PT bar is the summation of the effective strain due to initial post-tensioning, \( \varepsilon_{se} \), and the strain developed due to the rocking mechanism.
-
4.
Calculate the concrete strain at the extreme compressive fiber, \( \varepsilon_{c } , \) using Eq. 9,
$$ \varepsilon_{c } = \theta c/L_{pl} + \varepsilon_{0} $$(9)where \( L_{pl} \) is the plastic hinge length. No comprehensive study was found in the literature evaluating the plastic hinge length of UPTSCs, hence, the following expression, which was originally developed for wall member (Hassanli et al. 2015, 2016a) was adopted in this study,
$$ L_{pl} = 0.11(2r) + 3475\frac{{f_{c} }}{{f_{c}^{'} }} ({\text{mm}})$$(10)where \( f_{c}^{'} \) is the axial compressive strength of unconfined concrete (MPa), and \( f_{c} \) is the axial stress level which is defined as
$$ f_{c} = \frac{{f_{se} A_{ps} + N}}{{A_{c} }} $$(11)where \( A_{c} \) is the cross sectional area of concrete column.
-
5.
Calculate the stress developed in the PT steel using an appropriate constitutive model. In this study, the following elasto-plastic material model with linear kinematic hardening was considered,
$$ \sigma_{ps} = \left\{ {\begin{array}{*{20}l} {\varepsilon_{ps} E_{ps} } \hfill & {\varepsilon_{ps} \le \varepsilon_{py} } \hfill \\ {\varepsilon_{py} E_{ps} + (\varepsilon_{ps i} - \varepsilon_{py} )(f_{pu} - f_{py} )/(\varepsilon_{pu} - \varepsilon_{py} )} \hfill & {\varepsilon_{py} < \varepsilon_{ps} \le \varepsilon_{pu} } \hfill \\ 0 \hfill & {\varepsilon_{pu} < \varepsilon_{ps} } \hfill \\ \end{array} } \right.. $$(12) -
6.
Calculate the corresponding concrete stress. An appropriate stress–strain relationship must be utilized. In this study the following models were adopted for unconfined and FRP-confined concrete,
-
(a)
Unconfined concrete In this study Kent–Park stress–strain relationships was used (Eq. 13) (Kent and Park 1971) for unconfined concrete.
$$ f_{cj} \left( {\varepsilon_{cj} } \right) = \left\{ {\begin{array}{*{20}l} {f_{c}^{'} \left[ {\left( {\frac{{2\varepsilon_{cj} }}{0.002}} \right) - \left( {\frac{{\varepsilon_{cj} }}{0.002}} \right)^{2} } \right]} \hfill & {\varepsilon_{c j} < 0.002} \hfill \\ {f_{c}^{'} \left[ {1 - Z_{c} \left( {\varepsilon_{cj} - 0.002} \right)} \right]} \hfill & { 0.002 \le \varepsilon_{cj} \le \varepsilon_{cp} } \hfill \\ {0.2f_{c}^{'} } \hfill & { \varepsilon_{cj} > \varepsilon_{cp} } \hfill \\ \end{array} } \right. $$(13)where,
$$ \varepsilon_{cp} = 1.6\left[ {\frac{{3 + 0.29f_{c}^{'} }}{{145f_{c}^{'} - 1000}}} \right] + 0.0015 $$(14)where \( f_{cj} \left( {\varepsilon_{cj} } \right) \) is the concrete stress (MPa), and \( \varepsilon_{cj} \) is the concrete strain at distance \( x_{j} \) from the neutral axis (Fig. 3),
$$ \varepsilon_{cj} = (x_{j} /c) \varepsilon_{c } $$(15)Fig. 3 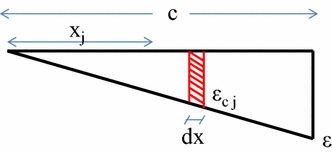
Strain of a typical element in the compression zone.
-
(b)
FRP-confined concrete Numerous models have been proposed to predict the stress–strain response of FRP-confined concrete. A comprehensive review of 88 models developed to predict the axial stress–strain behavior of FRP-confined concrete in circular sections was performed by Ozbakkaloglu et al. (2013). They considered both design-oriented and analysis-oriented models and to provide a comprehensive assessment of the models, a large test database of 730 FRP-confined concrete cylinders tested under monotonic axial compression was collected. Comparing all models, they concluded that the one developed by Lam and Teng (2003) was the most accurate model to predict the ultimate strength. Therefore, this model (provided below) was used in this study for FRP-confined specimens,
$$ f_{cj} \left( {\varepsilon_{cj} } \right) = \left\{ {\begin{array}{*{20}l} {E_{c} \varepsilon_{cj} - \frac{{(E_{c} - E_{c2} )^{2} }}{{4f_{0} }}\varepsilon_{cj}^{2} } & {\varepsilon_{cj} < \varepsilon_{c1} } \\ {f_{c}^{'} + E_{c2} \varepsilon_{cj} } & {\varepsilon_{c1} \le \varepsilon_{cj} \le \varepsilon_{cu} } \\ \end{array} } \right. $$(16)where,
$$ \varepsilon_{c1} = \frac{{2f_{c}^{'} }}{{E_{c} - E_{c2} }} $$(17)$$ E_{c2} = \frac{{f_{cc}^{'} - f_{c}^{'} }}{{\varepsilon_{cu} }} $$(18)$$ f_{0} = 0.872f_{c}^{'} + 0.371f_{l} + 6.258 $$(19)$$ f_{l} = \frac{{f_{FRP} t_{FRP} }}{r} $$(20)$$ f_{cc}^{'} = \left\{ {\begin{array}{*{20}c} {f_{c}^{'} (1 + 3.3\frac{{f_{lu,a} }}{{f_{c}^{'} }})} & {f_{l} \ge 0.07f_{c}^{'} } \\ {f_{c}^{'} } & {f_{l} < 0.07f_{c}^{'} } \\ \end{array} } \right. $$(21)$$ \varepsilon_{cu} = 1.75 + 5.53(\frac{{f_{lu,a} }}{{f_{c}^{'} }})(\frac{{\varepsilon_{FRP} }}{{\varepsilon_{co} }})^{0.45} $$(22)where \( f_{cc}^{'} \) = axial compressive strength of FRP-confined concrete (MPa); \( f_{l} \) = confining pressure provided by the FRP jacket (MPa); \( t_{FRP} \) = thickness of the FRP jacket; \( f_{FRP} \) = ultimate tensile strength of FRP material (MPa); \( f_{lu,a} \) = actual lateral confining pressure at ultimate (MPa) (= 0.586 \( f_{FRP} \) for CFRP (Lam and Teng 2003)); \( \varepsilon_{FRP} \) = ultimate tensile strain of FRP material; and \( \varepsilon_{co} \) = axial strain of unconfined concrete at \( f_{c}^{'} \) and \( \varepsilon_{cu} \) = ultimate axial strain of FRP-confined concrete.
-
(a)
-
7.
Calculate the total compression force, cc, and the total tension force, T, using Eqs. 23 and 24.
$$ c_{c} = \mathop \smallint \limits_{0}^{c} f_{cj} dA = \mathop \smallint \limits_{0}^{c} f_{cj} b_{w} dx $$(23)$$ T = \sigma_{ps} A_{ps} $$(24)where \( \sigma_{ps } \) can be determined using Eq. 12, \( f_{c j} \) can be determined using Eq. 13 or 16 for unconfined and FRP confined concrete, respectively, and \( b_{w} \) can be calculated form Eq. 32 or 33 for rectangular or circular cross sections, respectively.
-
8.
If \( c_{c} = T - N \) go to next step otherwise return to step 2.
-
9.
Calculate \( \Delta_{f} = \Delta_{0} + \Delta \)
-
10.
Take the moment about the neutral axis to calculate the total moment capacity, M, using Eq. 25.
$$ M = \sigma_{ps} A_{ps} \left( {d - c} \right) + N \left( {r - c} \right) - \int \nolimits_{0}^{c} f_{cj} xb_{w} dx $$(25) -
11.
The point with the coordinate of (∆ f , V = \( M/h_{c} \)) corresponds to a point in the force–displacement curve. To obtain another point, return to step 1. The flowchart shown in Fig. 4 presents the proposed procedure of the design approach.
Fig. 4 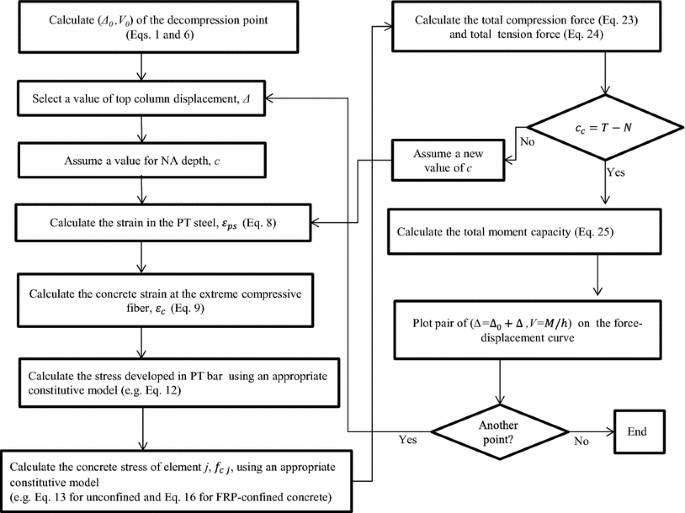
Analytical procedure flowchart to obtain the force–displacement response of UPTSCs.


It is worth noting that the presented force–displacement procedure considers only elastic flexural deformation (before decompression) and rocking response (beyond decompression). The deformation due to shear and sliding is ignored. In rocking columns with large aspect ratios (usually of higher than 3) (Priestley et al. 1996a), shear and sliding deformations typically have small magnitudes (Wight et al. 2007) and hence can be neglected, otherwise the corresponding displacement, \( \Delta_{s} \), needs to be considered to determine the total displacement (\( \Delta_{f} = \Delta_{0} + \Delta + \Delta_{s} \)).
3 Verification of Analytical Approach
The accuracy of the presented analytical approach was verified against the experimental results of eight columns tested by Hassanli et al. (2017). The properties of the test specimens are shown in Table 1. All the columns had a diameter of 150 mm and shear span of 1425 mm and were tested under incrementally displacement increasing reverse cyclic load. The top three segments in all columns were constructed out of crumb rubber concrete (CRC). The bottom-most segment in four column specimens (C50, C100, CF50 and CF100) was constructed out of conventional concrete (CC) and in the other four columns (CR50, CR100, CRF50 and CRF100) it was constructed out of CRC. The other variables were the level of initial PT force (50 kN in columns C50, CF50, CR50 and CRF50, and 100 kN in columns C100, CF100, CR100 and CR1050), and the effect of confining the bottom-most segments (unconfined and confined with 1 layer of FRP).
In the analytical approach, for both CC and CRC, the concrete material model presented in Eq. 12 was adopted. Due to rocking of columns about their bases and damage in only the bottom segments during the experiments, the material properties of CC and CRC were used for columns, C50, C100, CF50 and CF100 and columns CR50, CR100, CRF50 and CRF100, respectively.
Figure 5 plotted the lateral force–displacement curves obtained from the experimental study against those of the analytical approach. As shown in the figures, the model was able to correctly predict the column strength, initial stiffness, and post-peak behavior. The model could also capture the displacement recorded at different strengths.

Force–displacement response of UPTSCs. a C50, b C100, c CR50, d CR100, e CF50, f CF100, g CFR50, h CFR100.
The maximum lateral strengths of the columns obtained from the force–displacement curves of the analytical approach, V Analysis , are compared with corresponding experimental results, V EXP , in Table 2. As shown in the table, the analytical approach could accurately predict the strength of the walls. The predicted strength of the specimens using the analytical approach falls within ±12% of the average of the test results.
Figure 6 compares the force developed in the PT bars obtained from the experimental work and the analytical approach. As shown in the figure, in general, the analytical model showed a good correlation with the experimental results. Comparing the force developed in each PT bar at the peak strength of the columns using the analytical approach, T Analysis , and experimental results, T EXP , revealed that using the analytical approach, the PT force in the bars at the peak strength was within ±12% of the average of the test results. Note that the analytical model slightly overestimates the force in the bars, especially at large drifts. For example for column CR100 (see Fig. 6d), at large drift ratios, the PT force predicted by the analytical approach deviated from the experimental results. This overestimation can be attributed to the losses that occurred in the PT bars during testing, which are not considered in the analytical model. These losses occur due to movement of the anchorage, deflection of anchorage plates, elastic shortening of the column, the friction between the PT tendon and the wall of the ducts at higher drift ratios, which are very complicated and hence difficult to quantify. However, this over-prediction of PT stress is less sensitive when the force–displacement behavior is considered. As shown in Fig. 6d, the analytical procedure provided an acceptable prediction of the force–displacement response of column CR100. Also note that in both Figs. 6d and 7d the prediction from the analytical approach deviated from the experimental results after the column had experienced drift of higher than 4%. In practice, column drifts are limited to smaller values. For example in a building structure, due to the limited deformation capacity of non-structural elements and to control damage at life safety design level, the inter-story drift under the design level earthquake should not exceed 2% (IBC 2006; Priestley 2002). Due to these reasons the over-prediction of PT stresses at large drifts can be ignored.

PT force of UPTSCs. a C50, b C100, c CR50, d CR100, e CF50, f CF100, g CFR50, h CFR100.

Effect of concrete compressive strength.
The presented analytical procedure was developed for self-centering columns without energy dissipators; however, if internal mild steel or external dissipators or other similar devices are used, the approach can potentially be used if modified to account for the contribution of the dissipators on the moment capacity and stiffness of the column, as well as the possibility of joint opening between segments. Previous studies have shown that considering geometric compatibly concepts, a similar analytical approach can be used to predict the response of precast concrete hybrid frames and piers with external dissipators (Pampanin et al. 2001; Cao et al. 2015).
4 Parametric Study
As described, the presented analytical method was able to accurately predict the force–displacement behavior of UPTSCs and the force developed in the PT bars. The validated analytical approach was then used to conduct a parametric study to better understand the behavior of UPTSCs and also to develop expressions to predict the ductility of UPTSCs. The parametric study was performed in two stages by considering two different sets of column models. The first set was developed to examine the effect of different parameters on the behavior of UPTSCs, including concrete compressive strength, axial stress ratio, diameter and height of the column, axial stress level, duct size, stress ratio of the PT bars, and the thickness and ultimate tensile strain of the FRP wraps. Based on the analysis results obtained from the first set, design recommendations were provided for UPTSCs. Subsequently, matrices of column models were generated for the second stage (Stage II) of the parametric study. Stage II of parametric study was performed on a set of columns considering two parameters, axial stress ratio and aspect ratio as main variables to investigate the ductility of UPTSCs.
4.1 Parametric Study—Stage I
The first stage of the parametric study considered 43 columns in eight groups, shown in Table 3, to assess the influence of different parameters on column strength, deformation and ductility. As presented in Table 3, the columns C1-1 to C1-6, C2-1 to C2-7, C3-1 to C3-6, C4-1 to C4-5, C5-1 to C5-4, C6-1 to C6-6, C7-1 to C7-5, and C8-1 to C8-4 were used to study the effects of concrete compressive strength, \( f_{c}^{'} \), axial stress ratio, \( f_{c} /f_{c}^{'} \), axial stress level, \( f_{c} \), duct size, column diameter, D, column height, h c , FRP wrap thickness, t, and ultimate tensile strain of FRP, on the strength and deformation of UPTSCs.
Column C50 (Table 1) was considered as the “control” specimen. It had a height of 1425 mm and a 150 mm diameter circular cross section. The concrete compressive strength of 55 MPa, PT load of 50 kN, stub beam weight of 5 kN; and unbonded PT bar with the length of h c + 800 (mm), cross sectional area of 314.4 mm2, yield strength of 901 MPa, ultimate strength of 1102 MPa and elastic modulus of 200 GPa were considered for the control specimen. Moreover, the duct size factor, \( D_{f} \), of 0.03 was considered for the control specimen. The duct size factor, \( D_{f} \), is defined as,
where \( d_{duct} \) and \( d_{b} \) are the diameter of the duct and tendon/PT bar, respectively.
The effect of duct size is particularly significant for hollow sections. For example, when concrete masonry blocks or precast concrete hollow sections are used, the movement of the PT steel within the duct must be considered.
Figures 7, 8, 9, 10, 11, 12, 13, and 14 compare the lateral force–displacement response, normalized PT force (the force developed in the PT steel divided by the initial PT force), neutral axis (NA) depth divided by the column diameter, D, and moment capacity of the columns for each group of columns, respectively.

Effect of axial stress ratio.

Effect of axial stress level.

Effect of duct size.

Effect of column diameter.

Effect of column height.

Effect of FRP thickness.

Effect of FRP ultimate tensile strain.
4.1.1 Effect of Compressive Strength, \( f_{c}^{'} \)
To investigate the effect of \( f_{c}^{'} \), columns C1-1 to C1-6 with compressive strength of 25–75 MPa were generated. The responses are plotted in Fig. 7. As shown in the figure, as the compressive strength increased, the lateral strength and the normalized PT force increased and the NA depth decreased. As shown in Fig. 7b, columns with lower \( f_{c}^{ '} \) exhibited a decreasing trend of force developed in the PT steel at large drift ratios. This is attributed to the earlier damage of concrete in compression zone in columns with lower \( f_{c}^{ '} \). However, at higher \( f_{c}^{ '} \), the columns were intact for longer time at higher drift ratios as observed in specimens C1-5 and C1-6. The moment capacity of the columns increased from 3.8 to 4.7 kN m (24% increase) when the compressive strength increased from 25 to 75 MPa, see Fig. 7d.
4.1.2 The Effect of Axial Stress Ratio, \( f_{c} /f_{c}^{'} \)
The axial stress ratio is defined as the initial stress on the column, \( f_{c} \), divided by \( f_{c}^{'} \). The initial stress on the column was calculated as the summation of the initial PT force and the self-weight of the column and the loading beam, divided by the column cross sectional area, A g . In this parametric study, the axial stress ratio, \( f_{c} /f_{c}^{'} \), was varied from 0.032 to 0.263 in columns C2-1 to C2-7, by keeping the value of \( f_{c}^{'} \) constant and changing the PT force. As shown in Fig. 8 the level of \( f_{c} /f_{c}^{'} \), has significant effect on the lateral capacity, PT force and NA depth. Although in columns with higher \( f_{c} /f_{c}^{'} \), the lateral force capacity was higher, they exhibited a higher rate of post-peak strength degradation. This is attributed to the increased probability of concrete crushing at high stress levels that results in faster degradation of the lateral strength. The normalized PT force in the columns with lower \( f_{c} /f_{c}^{'} \) was significantly higher than that in columns with high levels of \( f_{c} /f_{c}^{'} \). While the NA depth comprised about 0.2D in the column C2-1 with \( f_{c} /f_{c}^{'} = 0.032 \) it increased to 0.45D in the column C2-7 with \( f_{c} /f_{c}^{'} = 0.263 \), see Fig. 8c. As shown in Fig. 8d, the moment capacity of column C2-1 was 3.2 kN m, however; it increased to 10.3 kN m in column C2-7. From all these comparisons it can be concluded that the axial stress ratio has significant effect on the capacity and behavior of UPTSCs.
4.1.3 The Effect of Axial Stress Level, \( f_{c} \)
Five different values of axial force were applied to columns C3-1 to C3-6, providing an axial stress ranging from 1.4 kN in column C3-1 to 14.2 kN in column C3-6. To maintain similar axial stress ratio (of 0.15) in all columns of this category, the value of \( f_{c}^{'} \) was varied accordingly. As shown in Fig. 9, as the axial stress level increased the lateral force capacity increased and the normalized PT force decreased. According to Fig. 9c, the NA depths of the columns of this category were similar and were about 0.35D at peak load for all columns. Consequently, as long as the axial stress ratio was constant, the NA depth was independent of the axial stress level. The moment capacity of the columns increased approximately linearly from 1.4 to 14.1 kN m as the axial stress level increased from 1.4 to 14.2 kN, see Fig. 9d.
4.1.4 The Effect of Duct Size, D f
If an oversized duct is used to accommodate the PT bar, then due to the rocking mechanism the PT bar moves towards the compression zone until it touches the duct’s inner wall. To investigate the effect of oversized ducts, five duct size factors, D f (see Eq. 26) were used ranging from 0 in column C4-1 to 0.13 in column C4-5. As shown in Fig. 10a, as the duct size factor increased, the lateral force capacity and the force developed in the PT steel decreased. This is attributed to the reduced lever arm. At peak strength, the NA depth was approximately similar in all columns of this category. Increasing the duct size factor from 0 to 0.13 caused the moment capacity to reduce from 5 to 3.2 kN m (about 36% reduction). Thus it is concluded that if an oversized duct or concrete hollow section is used, its negative effect on the effective PT depth, and hence the lateral strength of the columns, must be taken into account.
4.1.5 The Effect of Column Diameter, D
To investigate the effect of the diameter on the behavior of UPTSCs, columns C5-1 to C5-4 having diameters ranging from 150 to 450 mm were considered. As expected increasing the column diameter had significant effect on its behavior. The lateral strength, the PT force and the moment capacity increased as the diameter increased, as shown in Fig. 11. By increasing the column diameter, the lever arm of the concrete cross-section increases. This increases the moment capacity as well as the lateral strength of the column section and delays the column deterioration under cyclic loading, and hence results in a higher force in the PT bars (Fig. 11b).
4.1.6 Effect of Column HEIGHT, h c
Columns C6-1 to C6-6 (Table 3) having heights ranging from 0.5 to 3.0 m were generated to investigate the effect of the column’s height on the behavior of UPTSCs. As the height increased the lateral load capacity and the PT force decreased due to the decrease in the column stiffness by increasing its height. However, the moment capacity decreased slightly from 5.0 in column C6-1 to 4.1 in column C6-6. This can be attributed to the longer unbonded length of PT steel in longer columns compared with that of shorter columns which results in a lower PT strain, and hence lower PT forces compared with shorter columns. The decreased PT force results in reduced moment capacity in longer columns. Figure 12c shows that the NA depth of columns C6-1 to C6-6 remained relatively similar. At peak load the NA depth was about 0.20–0.25D for all columns in this category.
4.1.7 Effect of FRP Thickness, t FRP
As presented in Table 3, columns C7-1 to C7-5 were generated to investigate the influence of the FRP thickness, t FRP , on the behavior of FRP-confined specimens. As mentioned before for the FRP-confined concrete, the model propose by Lam and Teng (2003) was used. In this model the effect of FRP thickness (Eq. 20) is reflected in the stress–strain behavior of FRP-confined concrete (Eq. 16).
As shown in Fig. 13a, the stiffness of the columns remained relatively unchanged; however, as the FRP-wrap thickness increased the lateral force capacity and the level of PT force increased. By increasing the FRP thickness, the stiffness of the FRP jacket increases and its hoop strain decreases, and hence the micro cracks in the concrete core decrease. This keeps the column cross-section intact for a longer time at higher drifts which increases the column lateral strength and PT force development. The NA depth at the peak load was 0.2D for all columns of this category (Fig. 13c). As shown in Fig. 13d while the moment capacity of unconfined column, C7-1 was 4.5 kN m, it increased to 8.2 kN m in the FRP-confined column C7-5 with t FRP of 0.4 mm.
4.1.8 Effect of FRP Ultimate Tensile Strain, \( \varepsilon_{FRP} \)
A wide ultimate tensile strain range of 0.003–0.029 was reported for different types of FRP material (Lam and Teng 2001). Hence, FRP-confined columns C8-1, C8-2, C8-3, and C8-4 with \( \varepsilon_{FRP} = \) 0.003, 0.01, 0.02, and 0.03, respectively, were considered to investigate the effect of \( \varepsilon_{FRP} \) on the behaviour of UPTSCs. Note that the effect of FRP ultimate tensile strain is reflected in \( \varepsilon_{cu} \) in Eq. 22 which influence the stress–strain response of FRP-confined concrete (Eq. 16).
As shown in Fig. 14, increasing the FRP ultimate tensile strain resulted in an increase in the lateral force and PT force due to the increased deformation capacity of FRP with higher tensile strain. However, the NA depth at peak strength was about 0.2D in all columns. The moment capacity increased from 5.7 kNm in C8-1 to 6.6 kN m in column C8-4 (an increase of about 15%).
4.1.9 Ductility
To determine the displacement ductility of the UPTSCs, the capacity curves were first developed using the analytical method presented previously. The idealized bilinear curves of the capacity curves were then obtained using the following procedure, which has been widely used and adopted in previous studies (Priestley and Park 1987; Park and Paulay 1975; Ho and Pam 2002). The ultimate displacement, \( \Delta_{u} \), was taken as the displacement when the lateral strength of the column dropped by 20%. The yield displacement, \( \Delta_{y} \), yield strength,\( V_{y} \), and the effective yield stiffness, \( k_{e} \), was obtained using bilinear approximation of the force–displacement response of the columns, and the post-yield stiffness had a zero value (perfectly plastic). An iterative procedure was used to determine the idealized bilinear curves adopting the equal energy concept. The yield displacement and yield strength were determined such that the area under the idealized and capacity curves were equal and the two lines intersected at a strength of 0.75V y .
Unlike structural elements that have bonded reinforcement, the pseudo yielding point in the idealized backbone curve corresponds to the point where significant nonlinearity occurs (Hassanli et al. 2016b). In unbonded post-tensioned segmental systems, the nonlinearity occurs when the interface joint at the base of the column significantly opens leading to stiffness softening. Hence, the pseudo yielding point does not necessarily correspond to yielding of any bars, but rather it relates to stiffness softening of the column. The parameters obtained from bilinearization of the capacity curves are presented in Table 3. The displacement ductility values, μ, presented in the table were calculated using the following equation (Priestley et al. 2007):
The effect of different parameters on the displacement ductility is presented in Fig. 15 and Table 3. As the \( f_{c}^{'} \) increased the ductility increased, and the ductility was highly sensitive to high levels of \( f_{c}^{'} \) (Fig. 15a). By increasing the \( f_{c}^{'} \), the effective stiffness and the ultimate displacement increased; however, yield displacement decreased (Table 3). As shown in Fig. 15b, the ductility decreased as \( f_{c} /f_{c}^{'} \) increased and was very sensitive to lower levels of \( f_{c} /f_{c}^{'} \). As shown in Fig. 15c for the range of \( f_{c} \) considered, the ductility values remained relatively unchanged (category C3 of columns were considered in Fig. 15c, in which both \( f_{c} \) and \( f_{c}^{'} \) were varied, to maintain a constant \( f_{c} /f_{c}^{'} \)). It can be concluded that as long as \( f_{c} /f_{c}^{'} \), is constant, \( f_{c} \) and, \( f_{c}^{'} \) had nearly no effect on the ductility. Hence, out of three parameters, \( f_{c} \), \( f_{c}^{'} \) and \( f_{c} /f_{c}^{'} \), only \( f_{c} /f_{c}^{'} \) need to be considered to determine the ductility of UPTSCs. As shown in Fig. 15d, the duct size factor has only a slight effect on ductility. Generally, the duct size factor is small (unless a hollow section is used) and hence can be ignored. As shown in Fig. 15 and Table 3, as the column diameter reduces and the column height increased, the ductility increased. Instead of considering the effect of diameter and height separately, aspect ratios (height to the diameter ratio) of the columns of categories C4 and C5 are plotted against ductility. It can be seen that the ductility of the columns with larger aspect ratio is higher, and considering the smooth trend of data in Fig. 15g, it can be concluded that among the three parameters, diameter, height and aspect ratio, only the aspect ratio needs to be considered for ductility evaluation.

Effect of different parameters on the displacment ductility.
As shown in Fig. 15h and i adding FRP wrap resulted in decreased ductility. Also, the variation of the FRP thickness and ultimate tensile strain had negligible effect on ductility, and hence can be ignored. Consequently, for FRP-confined specimens, regardless of the thickness and type of FRP material, a minimum ductility of two can be considered. In the experimental study conducted by Hadi (Hadi 2009) the same adverse effect of FRP wrapping on the ductility of columns, beams and beam-column members was observed. This can be attributed to the method of bi-linearization of the capacity curve as well as the sudden rupture of the FRP layer at high drifts, which results in rapid strength degradation after the peak strength. Note that although the FRP-confined columns presented a low level of ductility they exhibited a large displacement capacity (Table 3).
4.2 Parametric Study—Stage II
In the previous section it was concluded that the ductility values of the specimens without FRP wrap depended mainly on two factors, the level of axial stress ratio and the column’s aspect ratio. The configuration of the columns in Stage II of the parametric study, which included 36 columns, was determined according to the conclusions obtained from Stage I of the parametric study. As mentioned, stage II of parametric study was performed on a set of columns considering two parameters, axial stress ratio and aspect ratio as main variables to investigate the ductility of UPTSCs. Axial stress ratios of 0.032, 0.042, 0.057, 0.109, 0.212 and 0.263 were considered by applying different PT forces. The aspect ratio was varied from 3.3 to 20, by considering six different column heights ranging from 0.5 to 3.0 m. The other parameters were fixed in all columns and were similar to the control specimen described in Stage I. Similar to Stage I, the force–displacement responses of the columns were first determined using the analytical procedure previously developed, and these responses where then used to calculate the ductility of the columns according to the procedure presented.
The ductility of columns is plotted against aspect ratio, h c /D, for columns with different axial stress ratios in Fig. 16a. As shown, the columns with low and high axial stress ratio exhibited different ductility behavior. In the columns with low axial stress ratios, as the aspect ratio increased, the ductility increased; however, in the columns with high axial stress ratio, the aspect ratio had an adverse effect on ductility. This ductility behavior of self-centering columns is different from what has been reported for conventional columns. In conventional columns as the aspect ratio increases the ductility decreases regardless of the level of axial stress ratio (Priestley et al. 1996b). As shown in Fig. 16a, the ductility of columns with low axial stress ratios was strongly sensitive to the aspect ratio. For the axial stress ratios of 0.032 and 0.042, the ductility was 9.3 and 6.0, respectively, for a column with h c /D = 3.3; however, it increased to 44.7 and 33.7 for a column with h c /D = 20. This significant effect of h c /D on the ductility at low axial stress levels can be attributed to the unbonded length of PT steel. At the same drift ratio, the rotation of the columns about their footing was similar resulting in equal elongation of the PT steel. Due to the greater heights of the columns with greater aspect ratio, the unbonded lengths of PT steel in these columns were larger, resulting in a reduced strain developed in these columns compared with columns with low h c /D. Lower strain caused less axial stress, leading to less damage and more ductility exhibited by the columns with high h c /D. As shown in Fig. 16a while in the column with an aspect ratio of 20 by applying an axial stress ratio of 0.042, the ductility reached a high value of more than 30, by slightly increasing the axial stress ratio to 0.057, the ductility dropped down significantly to 15.6. The sensitivity of the ductility to the level of axial stress in columns with high axial stress ratio was considerably lower than that in the columns with low axial stress ratios. However, in the columns with high axial stress ratios the aspect ratio had adverse effect on the ductility. While the ductility of the columns with axial stress ratios of 0.212 and 0.264 was 12.8 and 13.7 for columns with h c /D = 3.3, respectively, it reduced to 9.8 and 7.4 for columns with h c /D = 20.

Effect of axial stress ratio and aspect ratio on the a ductility, b moment capacity.
Figure 16b indicates the effect of axial stress ratio and aspect ratio on the moment capacity of the columns of Stage II of the parametric study. As shown in the figure, increasing the axial stress ratio resulted in an increase in the moment capacity of the column. This behavior was nearly independent of the column’s aspect ratio, especially for the columns with higher axial stress ratios. At low axial stress ratios, the moment capacity of columns with lower h c /D was slightly higher than those with higher h c /D. This can be attributed to the higher level of force in the PT steel in columns with lower h c /D. Between two identical columns with different heights, the unbonded length of the PT steel is usually smaller in the shorter one, resulting in a higher level of force developed in the PT steel. Of two identical columns with different diameters, at the same drift ratio, the elongation of the PT steel in the column with greater diameter is higher (due to greater lever arm), leading to a higher level of force in the PT steel.
The moment capacity of the columns with low axial stress ratio is comparatively small, as shown in Fig. 16b. In practice to reach the required strength and to provide an economical design the axial stress ratio is usually higher than 5% (Hassanli et al. 2016b). Moreover, a minimum level of axial stress ratio is required to prevent sliding of the segments and provide enough shear capacity transferred between the segments and at the column-footing interface.
By ignoring the columns with the axial stress ratio of less than 5%, the range of the ductility of the columns reduces to 5.2 to 15.6, as shown in Fig. 17a. As shown in the figure, a μ = 5 can be considered as the minimum ductility of UPTSCs.

As shown in Fig. 17a the ductility values of columns with h c /D = 10, was approximately similar, regardless of the level of axial stress ratio. Considering a linear relationship between ductility and h c /D, Eq. 28 can be used to estimate the ductility of UPTSCs.
where \( \alpha \) is the slope of the μ − h c /D lines. To develop an equation to estimate the \( \alpha \) value, a nonlinear multiple regression analysis was performed for the columns of the Stage II of the parametric study, excluding the ones with axial stress ratio of less than 0.05, and the following equation was obtained,
The ductility prediction using Eq. 28 is plotted against h c /D for different level of axial stress ratio in Fig. 17b. As shown the ductility calculated using Eq. 28 could approximately estimate the ductility obtained from analytical method. The predicted ductility versus the ductility of the columns obtained using the analytical method is presented in Fig. 18a. As shown, the model was able to effectively predict the ductility of the columns. However, Eq. 28 slightly overestimates the ductility of some columns. Consequently, to provide a safer design, Eq. 30 (Fig. 17c) is proposed in lieu of Eq. 28 to predict the ductility of unconfined UPTSCs.
The predicted ductility obtained using Eq. 30 is plotted against the ductility values obtained using analytical method in Fig. 18b. As shown, the equation could provide a conservative prediction of the ductility of UPTSCs.

4.3 Neutral Axis (NA) Depth
If the depth of neutral axis is known, the elongation of the PT steel and the concrete deformation at the compression zone at different column rotations can be determined accordingly. As shown in Figs. 7, 8, and 9 at peak strength, the concrete compressive strength and axial stress ratio influence the NA depth however, the level of axial stress seems to have no effect on the NA depth. The column height, FRP thickness and FRP ultimate tensile strains have negligible effect on the NA depth (see Figs. 12, 13, 14), hence, can be ignored, however as shown in Fig. 11, column diameter does have considerable an effect on the NA depth. Using the column matrix of Stage I (Table 3), multivariate regression analysis was performed and the following equation was obtained to determine the NA depth of UPTSCs,
The predicted NA depth obtained using Eq. 31 is plotted against the corresponding values obtained using the analytical method in Fig. 19. As shown, the equation provides an acceptable prediction of the ductility of UPTSCs. Equation 31 can be used for both confined and unconfined circular cross sections, however, its accuracy for square cross sections and sections with diameter of larger than 450 mm needs to be examined.

Predicted NA depth.
5 Conclusion
In this study the behavior of unbonded post-tensioned segmental columns (UPTSCs) was investigated using an analytical method. The accuracy of the method was first verified against experimental results, followed by a parametric study to investigate the effect of different parameters on the behavior and strength of UPTSCs. Multivariate regression analysis was also performed to develop expressions to determine the ductility and NA depth of UPTSCs. The following conclusions were drawn:
-
1.
The analytical approach considering single joint rotation, could effectively predict the response of UPTSCs. It was shown that the moment capacity of UPTSCs was highly sensitive to the level of axial stress and axial stress ratio, and less sensitive to the concrete compressive strength.
-
2.
Oversized duct has negative effect on the effective depth of the PT bars, and hence the lateral strength of the columns. Hence, the strength reduction due to oversized ducts must be taken into account.
-
3.
The ductility of unbonded post-tensioned columns is strongly affected by two factors, the level of axial stress ratio and the aspect ratio. However, as long as the axial stress ratio, \( f_{c}^{'} /f_{c} \), is constant, the level of axial stress, \( f_{c} \), and compressive strength of concrete, \( f_{c}^{'} \), has nearly no effect on the ductility.
-
4.
For unconfined UPTSCs, for high levels of aspect ratio (h c /D > 10), the ductility decreased as the axial stress ratio increased; however, at low levels of aspect ratio (h c /D < 10) the ductility increased as the axial stress ratio increased. Equation 30 was proposed to estimate the displacement ductility of those columns.
References
Bu, Z.-Y., & Ou, Y.-C. (2013). Simplified analytical pushover method for precast segmental concrete bridge columns. Advances in Structural Engineering, 16, 805–822.
Bu, Z.-Y., Ou, Y.-C., Song, J.-W., Zhang, N.-S., & Lee, G. C. (2015). Cyclic loading test of unbonded and bonded posttensioned precast segmental bridge columns with circular section. Journal of Bridge Engineering, 21, 04015043.
Cao, Z., Guo, T., Xu, Z., & Lu, S. (2015). Theoretical analysis of self-centering concrete piers with external dissipators. Earthquakes and Structures, 9, 1313–1336.
Chang, K., Loh, C., Chiu, H., Hwang, J., Cheng, C., & Wang, J. (2002). Seismic behavior of precast segmental bridge columns and design methodology for applications in Taiwan. Taipei: Taiwan Area National Expressway Engineering Bureau.
Chou, C.-C., Chang, H.-J., & Hewes, J. T. (2013). Two-plastic-hinge and two dimensional finite element models for post-tensioned precast concrete segmental bridge columns. Engineering Structures, 46, 205–217.
Chou, C. C., & Chen, Y. C. (2006). Cyclic tests of post-tensioned precast CFT segmental bridge columns with unbonded strands. Earthquake Engineering and Structural Dynamics, 35, 159–175.
Dawood, H., ElGawady, M., & Hewes, J. (2011). Behavior of segmental precast posttensioned bridge piers under lateral loads. Journal of Bridge Engineering, 17(5), 735–746.
ElGawady, M., Booker, A., & Dawood, H. (2010). Seismic behavior of posttensioned concrete-filled fiber tubes. Journal of Composites for Construction, 14(5), 616–628.
ElGawady, M., & Sha’lan, A. (2011). Seismic behavior of self-centering precast segmental bridge bents. Journal of Bridge Engineering, 16(3), 328–339.
Hadi, M. N. (2009). Behaviour of eccentric loading of FRP confined fibre steel reinforced concrete columns. Construction and Building Materials, 23, 1102–1108.
Hassanli R. (2015). Behavior of unbonded post-tensioned masonry walls. PhD Thesis, University of South Australia, South Australia.
Hassanli, R., ElGawady, M., & Mills, J. (2015). Plastic hinge length of unbonded post-tensioned masonry walls. 12th North American Masonry. Denver: The Masonry Society.
Hassanli, R., ElGawady, M. A., & Mills, J. E. (2016a). Force–displacement behavior of unbonded post-tensioned concrete walls. Engineering Structures, 106, 495–505.
Hassanli, R., ElGawady, M., & Mills, J. (2016b). Experimental investigation of in-plane cyclic response of unbonded posttensioned masonry walls. Journal of Structural Engineering, 142, 04015171.
Hassanli, R., ElGawady, M., & Mills, J. (2017a). In-plane flexural strength of unbonded post-tensioned concrete masonry walls. Engineering Structures, 136, 245–260.
Hassanli, R., Youssf, O., & Mills, J. (2017b). Seismic performance of precast post-tensioned aegmental crumb rubber concrete columns. Journal of Composites for Construction, 21, 04017006.
Henry RS. Self-centering precast concrete walls for buildings in regions with low to high seismicity. PhD Thesis, Department of Civil and Environmental Engineering, University of Auckland. Auckland, New Zealand; 2011.
Hewes, J. T., & Priestley, M. J. N. (2002). Seismic design and performance of precast concrete segmental bridge columns. Berkeley, CA: Dept. of Structural Engineering, University of California.
Ho, J., & Pam, H. (2002). Flexural strength and ductility performance of high-strength reinforced concrete columns. Structural Engineering, 80, 26–34.
IBC I. International building code. International Code Council, Inc (formerly BOCA, ICBO and SBCCI). 2006;4051:60478–65795.
Kent, D. C., & Park, R. (1971). Flexural members with confined concrete. Journal of the Structural Division, 97(7), 1969–1990.
Kim, T.-H. (2013). Comparison of totally prefabricated bridge substructure designed according to Korea Highway Bridge Design (KHBD) and AASHTO-LRFD. International Journal of Concrete Structures and Materials, 7, 319–332.
Kim, J., & Choi, H. (2015). Monotonic loading tests of RC beam-column subassemblage strengthened to prevent progressive collapse. International Journal of Concrete Structures and Materials, 9, 401–413.
Kim, T.-H., Lee, H.-M., Kim, Y.-J., & Shin, H. (2010). Performance assessment of precast concrete segmental bridge columns with a shear resistant connecting structure. Engineering Structures, 32, 1292–1303.
Kim, D. H., Moon, D. Y., Kim, M. K., Zi, G., & Roh, H. (2015). Experimental test and seismic performance of partial precast concrete segmental bridge column with cast-in-place base. Engineering Structures, 100, 178–188.
Kim, T.-H., Seong, D.-J., & Shin, H. M. (2012). Seismic performance assessment of hollow reinforced concrete and prestressed concrete bridge columns. International Journal of Concrete Structures and Materials, 6, 165–176.
Kurama, Y. C., Sause, R., Pessiki, S., & Lu, L. W. (2002). Seismic response evaluation of unbonded post-tensioned precast walls. ACI Structural Journal, 99(5), 641–651.
Kwan, W.-P., & Billington, S. L. (2003). Unbonded posttensioned concrete bridge piers. I: Monotonic and cyclic analyses. Journal of Bridge Engineering., 8, 92–101.
Lam L, Teng J. (2001). A new stress-strain model for FRP-confined concrete. FRP Composites in Civil Engineering Proceedings of the International Conference on FRP composites in Civil Engineering (pp. 283–292). Amsterdam: Elsevier Science Publishing Company.
Lam, L., & Teng, J. (2003). Design-oriented stress–strain model for FRP-confined concrete. Construction and Building Materials, 17, 471–489.
Marriott, D., Pampanin, S., & Palermo, A. (2009). Quasi-static and pseudo-dynamic testing of unbonded post-tensioned rocking bridge piers with external replaceable dissipaters. Earthquake Engineering and Structural Dynamics, 38, 331–354.
Motaref, S., Saiidi, M., & Sanders, D. (2010). Experimental study of precast bridge columns with built-in elastomer. Transportation Research Record, 2202, 109–116.
Motaref, S., Saiidi, M. S., & Sanders, D. (2013). Shake table studies of energy dissipating segmental bridge columns. Journal of Bridge Engineering, 19, 186–199.
Ou, Y.-C., Chiewanichakorn, M., Aref, A. J., & Lee, G. C. (2007). Seismic performance of segmental precast unbonded posttensioned concrete bridge columns. Journal of Structural Engineering, 133, 1636–1647.
Ou, Y.-C., Oktavianus, Y., & Tsai, M.-S. (2013). An emulative precast segmental concrete bridge column for seismic regions. Earthquake Spectra, 29, 1441–1457.
Ou, Y. C., Tsai, M. S., Chang, K. C., & Lee, G. C. (2010). Cyclic behavior of precast segmental concrete bridge columns with high performance or conventional steel reinforcing bars as energy dissipation bars. Earthquake Engineering and Structural Dynamics, 39, 1181–1198.
Ou, Y.-C., Wang, P.-H., Tsai, M.-S., Chang, K.-C., & Lee, G. C. (2009). Large-scale experimental study of precast segmental unbonded posttensioned concrete bridge columns for seismic regions. Journal of Structural Engineering, 136, 255–264.
Ozbakkaloglu, T., Lim, J. C., & Vincent, T. (2013). FRP-confined concrete in circular sections: Review and assessment of stress–strain models. Engineering Structures, 49, 1068–1088.
Palermo, A., Pampanin, S., & Marriott, D. (2007). Design, modeling, and experimental response of seismic resistant bridge piers with posttensioned dissipating connections. Journal of Structural Engineering, 133, 1648–1661.
Pampanin, S., Priestley, M. N., & Sritharan, S. (2001). Analytical modelling of the seismic behaviour of precast concrete frames designed with ductile connections. Journal of Earthquake Engineering, 5, 329–367.
Park, R., & Paulay, T. (1975). Reinforced concrete structures (pp. 53–54). New York: Wiley.
Perez, F., Sause, R., & Pessiki, S. (2007). Analytical and experimental lateral load behavior of unbonded posttensioned precast concrete walls. Journal of Structural Engineering, 133(11), 1531–1540.
Priestley, M. (2002). Direct displacement-based design of precast/prestressed concrete buildings. PCI Journal, 47, 66–79.
Priestley M, Calvi G, Kowalsky M. (2007). Direct displacement-based seismic design of structures. In NZSEE conference 2007.
Priestley, M., & Park, R. (1987). Strength and ductility of concrete bridge columns under seismic loading. ACI Structural Journal, 84, 61–76.
Priestley, M., Seible, F., & Calvi, G. (1996a). Seismic design and retrofit of bridges. Newyork: Wiley.
Priestley, M. N., Seible, F., & Calvi, G. M. (1996b). Seismic design and retrofit of bridges. New York: Wiley.
Priestley, M., Sritharan, S., Conley, J. R., & Pampanin, S. (1999). Preliminary results and conclusions from the PRESSS five-story precast concrete test building. PCI Journal, 44, 42–67.
Roh, H., & Reinhorn, A. M. (2010). Hysteretic behavior of precast segmental bridge piers with superelastic shape memory alloy bars. Engineering Structures, 32, 3394–3403.
Roh, H., Reinhorn, A. M., & Lee, J. S. (2012). Modeling and cyclic behavior of segmental bridge column connected with shape memory alloy bars. Earthquake Engineering and Engineering Vibration, 11, 375–389.
Shajil, N., Srinivasan, S. M., & Santhanam, M. (2016). An experimental study on self-centering and ductility of pseudo-elastic shape memory alloy (PESMA) fiber reinforced beam and beam-column joint specimens. Materials and Structures, 49, 783–793.
Shim, C. S., Chung, C.-H., & Kim, H. H. (2008). Experimental evaluation of seismic performance of precast segmental bridge piers with a circular solid section. Engineering Structures, 30, 3782–3792.
Sideris, P. (2015). Nonlinear quasi-static analysis of hybrid sliding–rocking bridge columns subjected to lateral loading. Engineering Structures, 101, 125–137.
Wang, J. C., Ou, Y. C., Chang, K. C., & Lee, G. C. (2008). Large-scale seismic tests of tall concrete bridge columns with precast segmental construction. Earthquake Engineering and Structural Dynamics, 37, 1449–1465.
Wight, G. D., Kowalsky, M. J., & Ingham, J. M. (2007). Direct displacement-based seismic design of unbonded post-tensioned masonry walls. ACI Structural Journal, 104(5), 560–569.
Yamashita, R., & Sanders, D. (2009). Seismic performance of precast unbonded prestressed concrete columns. ACI Structural Journal, 106, 821–830.
Youssf, O., ElGawady, M. A., & Mills, J. E. (2015a). Experimental investigation of crumb rubber concrete columns under seismic loading. Structures (pp. 13–27). Amsterdam: Elsevier.
Youssf, O., ElGawady, M. A., & Mills, J. E. (2015b). Displacement and plastic hinge length of FRP-confined circular reinforced concrete columns. Engineering Structures, 101, 465–476.
Youssf, O., ElGawady, M. A., & Mills, J. E. (2016). Static cyclic behaviour of FRP-confined crumb rubber concrete columns. Engineering Structures, 113, 371–387.
Author information
Authors and Affiliations
Corresponding author
Appendix
Appendix
The width of the element, \( b(x) \) (Fig. 1), can be calculated as,
Substituting Eqs. 3, 32 and 33 in 2, gives,
And the corresponding lever arm can be calculated as,
Rights and permissions
Open Access This article is distributed under the terms of the Creative Commons Attribution 4.0 International License (http://creativecommons.org/licenses/by/4.0/), which permits unrestricted use, distribution, and reproduction in any medium, provided you give appropriate credit to the original author(s) and the source, provide a link to the Creative Commons license, and indicate if changes were made.
About this article

Cite this article
Hassanli, R., Youssf, O., Mills, J. et al. Analytical Study of Force–Displacement Behavior and Ductility of Self-centering Segmental Concrete Columns. Int J Concr Struct Mater 11, 489–511 (2017). https://doi.org/10.1007/s40069-017-0209-4
Received:
Accepted:
Published:
Issue Date:
DOI: https://doi.org/10.1007/s40069-017-0209-4