- Open access
- Published:
Modeling of Bond Stress–Slip Relationships of a Strand in Concrete during Steam Curing
International Journal of Concrete Structures and Materials volume 11, pages 477–487 (2017)
Abstract
The restrained thermal expansion of a pretensioned strand causes thermal prestress loss during steam curing until sufficient bond strength develops. The amount of thermal prestress loss is directly related to the characteristics of the interfacial bond stress–slip relationship at different maturity phases of concrete. For a rational assessment, the bond stress–slip relationship needs to be investigated experimentally at different maturity phases. In this study, a total of 12 pull-out tests were performed using seven-wire strand of 12.7 mm diameter, at different concrete equivalent ages of 7.8, 23.5, 53.8 and 85.2 h. Based on the test results, an empirical model of the bond stress–slip relationship was developed. The model comprised four segments: a curvilinear ascending region, a constant maximum region, a linearly descending region, and a region of constant frictional bond stress. The characteristic values in the model were expressed as functions of equivalent age. The model was able to predict the test results with reasonable accuracy.
1 Introduction
Extensive experimental and theoretical studies have been performed for several decades for prestressed concrete to find its short and long-term behavior as well as seismic performance (Freyssinet 1954; Huang 1980; Naaman and Alkahiri 1991; Ahlborn et al. 2000; Lu et al. 2016; Singh et al. 2013; Kim et al. 2012a, b, 2016; Jeon et al. 2015). Unlike reinforced concrete, prestressed concrete suffers from prestress loss. Accordingly, prediction of prestress loss has been a key concern (Rizkalla et al. 2011).
In mass fabrication of precast pretensioned concrete, steam curing is used to accelerate the hydration process and to achieve the specified release strength. Relatively recent research has reported that thermal prestress loss occurs during steam curing (Ahlborn et al. 2000; Bruce et al. 2001; Roller et al. 2003; Tadros 2003; Barr et al. 2005; Erkmen et al. 2008; Newhouse and Wood 2008; Rizkalla et al. 2011).
Thermal prestress loss occurs in a strand during steam curing because its axial thermal extension is restrained owing to the fixing of its ends in the prestressing bed (Fig. 1). During steam curing, thermal extension of the strand at time t i causes local slip and bond stress at location x between the strand and the surrounding concrete [s(x) and τ(x) in Fig. 1, respectively]. The amount of τ(x) corresponding to s(x) is determined by the bond stress–slip relationships developed at time t i . As a sufficient bonding develops between the embedded strand and the surrounding concrete, the strand and concrete form a composite. Thereafter, the strand becomes compatible with the surrounding concrete, without local slippage. As a result, thermal prestress loss is locked in and becomes irrecoverable in concrete (Barr et al. 2005).

Bond stress and slip developed at t e = t i .
The amount of thermal prestress loss depends directly upon the bond stress–slip relationships during the steam curing process. Although it seems to be necessary priori knowledge to understand the bond stress–slip relationships of a strand in concrete at elevated temperature, no research has been reported in the literature. Absent such knowledge, inconsistent bonding time has been assumed for the purpose of estimating thermal prestress loss in the literature. Barr et al. (2005) estimated the thermal prestress loss of 3–7% of the initial prestress if bonding occurred within the range of 6–10 h after casting. Roller et al. (2003) suggested that thermal prestress loss prior to release was 6% if bonding occurred within 6 h after casting. Erkmen et al. (2008) assumed that thermal prestress loss occurred until the concrete reached its maximum temperature. To validate the theoretical estimation of thermal prestress loss, the occurrence of bonding in different steam curing regimes must be investigated.
It has been reported that bond stress–slip relationships are greatly influenced by the surrounding concrete strength (Choi 1988; Eurocode2 2004; Campione et al. 2005; Missouri University of Science and Technology 2012). In steam curing, the development of concrete strength is affected by both the temperature and the curing duration. Accordingly, due consideration must be paid to concrete maturity in the modeling of bond stress–slip relationships of a strand embedded in concrete during the steam curing process. A comprehensive literature search indicated that no information was available regarding the bond stress–slip behavior of strands in concrete at elevated temperature during steam curing. Accordingly, in the present study pull-out tests were performed of specimens subjected to various steam curing conditions, and a model of bond stress–slip relationships for strands was developed to serve as a tool in determining the bonding time. This model was based upon the concept of an equivalent age.
2 Experiments
The main purpose of the pull-out tests performed in this study was to investigate the local bond-slip behavior of a strand embedded in concrete under various conditions of concrete maturity, which is influenced by both the curing temperature and time duration. Accordingly, the temperature of the concrete in the vicinity of the embedded strand was recorded throughout the experimental process.
The bond-slip tests were designed by using RILEM 7-II-128 (1994) as a guide. According to the RILEM 7-II-128, the reinforcing bar will be embedded in the concrete a total length of 15 times the bar diameter to be tested. For a bonded breaker, a length of 7.5 times the bar diameter is to be placed so that the bar is unbonded from the bottom surface to halfway in the concrete, leaving a bonded length of 7.5 times the bar diameter. Some details of the test method, however, were slightly modified based upon previous work by Choi (1988) and Campione et al. (2005) for better estimation of bond-slip relationships. In this experiment, the bars were embedded in concrete a total length of 16.5 times the bar diameter with a bond length of 5d ps = 63.5 mm (Choi 1988; Campione et al. 2005). The embedded and bonded lengths adopted in this experiment has been reported to produce approximately uniform bond-stress and slip distribution, and to reduce the scatter of test results observed with very short bonded lengths (Eligehausen et al. 1983a, b).
2.1 Preparation of Experiments
Figures 2a, b illustrate the pull-out specimen and its test setup. Table 1 lists specimen names and details on their test conditions. Each specimen is named following the format of ‘PNR’, where the letter P represents a pull-out test specimen, N the elapsed time in hours of steam curing (N = 4, 6, 8 and 10 for 4, 6, 8 and 10 h of steam curing, respectively) and R distinguishes between replicate specimens prepared in the same conditions.

Pull-out specimens and test setup. a Reinforcement of pull-out specimens and b test setup.
Pull-out tests were performed upon seven-wire strands each having a total length of 910 mm. A 210 mm portion of its length was embedded and passed through a prismatic concrete block of 210 × 210 × 210 mm. A bond of length 5d ps = 63.5 mm was made within the embedded portion, where d ps (12.7 mm) is the diameter of strand; the remaining parts were left unbonded. This bonded length of 63.5 mm was short enough to produce approximately uniform bond stress and slip distributions, but long enough to reduce the scatter of test results usually observed for bonds of very short length (Eligehausen et al. 1983a, b). Confinement reinforcements (both vertical and transverse bars) were provided in the specimen to prevent splitting failure of the concrete (Fig. 2a). The diameter and yield strength of the deformed bars used for confinement reinforcement were 6 mm and 400 MPa, respectively. The nominal tensile strength of the seven-wire strand used in the pull-out tests was 1820 MPa. The concrete used in the standard specimen had a 28-day compressive strength of 37 MPa. The maximum size of the aggregate in the concrete was 19 mm.
A thermocouple was positioned near the bonded part of the strand to measure temperature changes in the specimen during steam curing process. Insulation tube was used to prevent bonding outside of the designed bonding length (Fig. 2a).
To determine the changes in bond-slip relationships under different conditions of concrete maturity, each pull-out specimen was removed from the steam chamber at a specific elapsed time after the steam supply was initiated. Soon after, the strand was pulled out monotonically. A pull-out force was applied at one end and bar slippage was measured at the other end (Fig. 2b).
2.2 Experimental Procedure
Experiments were performed in the following order: the steam curing chamber was assembled, the confinement steel cage was placed in the mold and the strand was positioned, concrete was casted into the pull-out molds, steam was emitted into the chamber according to the given steam curing regime, and pull-out tests were performed at various equivalent ages.
The procedures are described in detail as follows.
-
(1)
A steam curing chamber was assembled from sandwich panels made of 30 mm thick insulating polyethylene foam boards and thin steel sheets for panel covers. Specimens inside the chamber were supported with wooden pallets during the steam curing process to keep cooled condensed water from adversely affecting the specimen temperature (Fig. 3a).
Fig. 3 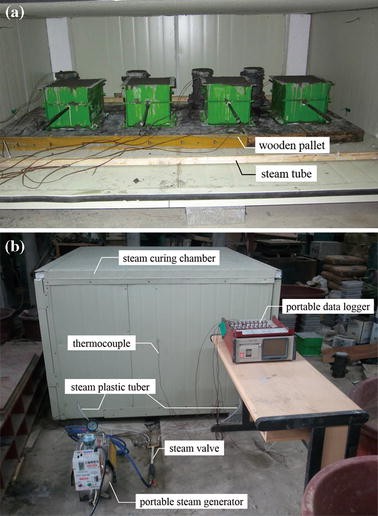
Steam curing chamber. a Placement of pull-out specimens in the curing chamber and b test setup for curing and data collections.
-
(2)
Two plastic tubes 8 mm in diameter were placed parallel to the width of the chamber. These tubes were connected to a portable steam generator. To prevent possible movement of tubes from their original position during the steam curing process, they were fixed to the rod to hold them straight (Fig. 3a). Holes were made along the lengths of these tubes to allow emission of steam. During testing, steam temperature was manually monitored by measuring the temperatures at four different locations in the chamber, namely points at mid-height and at the bottom of either side of the curing chamber (Fig. 3b).
-
(3)
For pull-out test specimens, a prefabricated confinement steel cage was placed in the pull-out steel mold. A strand was placed through the holes in the mold; part of the strand in the mold was covered with insulation tube to prevent bonding; the middle portion of 5d ps = 62.5 mm was left uncovered to allow bonding. To measure the temperature in the vicinity of the bonded portion of the strand, a thermocouple was placed near this portion in each specimen.
-
(4)
Concrete was cast into the steel mold and vibrated by using portable rod vibrators. During the vibration, caution was taken not to damage or displace the unbonded part, the confinement reinforcements, and the thermocouple.
-
(5)
Specimens were carefully placed on the wooden pallets in the curing chamber.
-
(6)
For each specimen, two concrete cylinders 100 mm in diameter and 200 mm long were fabricated for use in measuring compressive strength at the time of the pull-out test. One thermocouple was embedded in each cylinder to measure the temperature changes. These cylinders were then placed inside the curing chamber.
-
(7)
Steam was supplied by a steam generator connected to the chamber by plastic tubes, and testing continued for 10 h following a typical 3–6–3 h steam curing regime (Fig. 4a). The steam curing regime adopted in this study consisted of four periods totaling 13 h: a 1 h delay period at ambient temperature (approximately 20 °C); a 3 h positive temperature ramp, 6 h of curing at the constant maximum temperature of 60 °C, and a 3 h negative temperature ramp for cooling. During the steam curing process, thermocouples were used to measure the temperatures both inside the chamber and inside the concrete in the pull-out specimens.
Fig. 4 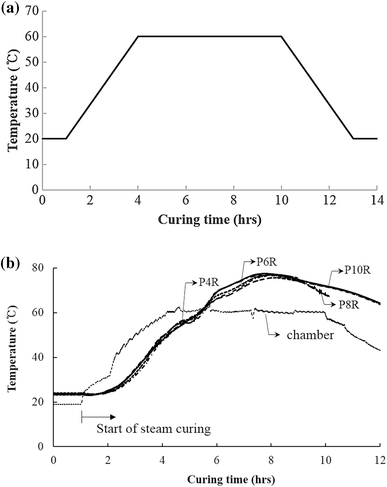
Steam curing. a 3–6–3 h steam curing regime and b changes in the measured temperature inside chamber and concrete in the pull-out specimen.
-
(8)
Pull-out specimens and concrete cylinders were removed from the curing chamber at specific curing times (4, 6, 8 and 10 h) during the steam curing.
-
(9)
After the completion of the steam curing process, the pull-out specimens and concrete cylinders removed from the curing chamber at the same age were demolded. As soon as the specimens demolded, pull-out tests were performed on each pull-out specimen and the concrete cylinders were simultaneously tested for their compressive strength. To avoid undesirable eccentricity during the compression test, the ends of the cylinders were prepared by capping them with compound rather than grinding them. This minimized possible damage to the cylinders resulting from impact during the grinding process, an important consideration for testing of the immature concrete samples that underwent insufficient curing.


2.3 Test Results
2.3.1 Temperatures and Concrete Strengths
Figure 4b shows typical histories of temperature changes measured inside the chamber and inside the concrete in the pull-out mold. At the beginning stage of steam curing, the temperature increase of concrete within the specimen followed that inside the chamber with a delay of approximately 1 h. As hydration of the concrete proceeded, the temperature within the specimen exceeded the maximum temperature inside the chamber (60 °C), reaching the maximum temperature of 76.2 °C at the elapsed time of 7.7 h of steam curing.
All tested specimens showed similar temperature changes, because their mix proportions and the given steam curing schedule were the same. After reaching the peak temperature, the concrete in each specimen cooled gradually.
Table 1 lists the measured strengths of the concrete specimens cured for different times. Average compressive strength increased with curing time: 2.4, 8.5, 15.1, and 23.9 MPa for 4, 6, 8, and 10 h, respectively. The average 28-day compressive strength of two 100 mm × 200 mm concrete cylinders, cured at the ambient temperature of 22 °C, was measured to be 37 MPa.
2.3.2 Bond Stress–Slip Relationships
It has been reported that the bond stress–slip relationship of a deformed steel bar embedded in 28-day air-cured concrete consists of an increasing curvilinear part, followed by a constant part at the maximum bond stress, a linearly decreasing part, and a constant tail part indicating the frictional bond resistance (Choi 1988; fib model code 2013). Figure 5 shows the different experimentally observed bond stress–slip relationships for seven-wire strands of diameter 12.7 mm that were embedded in the concrete specimens of various maturities depending upon the steam curing duration. Bond stress (τ) in MPa was measured by dividing the measured pull-out force by the circumferential surface area of the bonded length of the embedded strand, which was 2532.3 mm2 for each strand used in the pull-out tests. Similar shape of bond stress–slip relationships of strands in concrete can be observed in Fig. 5 compared with that of a deformed bonded bar tested 28 days after casting. As the elapsed time of steam curing increased, the resulting specimens showed increasing compressive strength, and increased bond strength and initial stiffness were observed in the bond stress–slip relationships.

Experimentally observed bond stress–slip relationships measured at different maturity phases of concrete.
All the measured bond-slip relationships could be characterized by four different regions, regardless of their maturity: a prepeak ascending portion, an approximately constant plateau at the maximum stress, a gradually descending region, and an approximately constant residual region. Table 1 presents measured values of concrete strength and characteristic points (bond stress and corresponding slip) as well as calibrated ones for α b , η and ν given by Eqs. (5a), (7a) and (7b), respectively. In the prepeak ascending region, adhesion bond strength was shown to increase for samples subjected to longer curing. After the failure of the adhesion bond, bond stress further increased with the increased slip. Accordingly, the stiffness in the ascending portion of the bond stress and slip relationships was reduced. For all cases, a constant peak region appeared at slip values between 5 and 10 mm. The maximum bond stress was maintained throughout an additional slip of about 5 mm after reaching the peak value. The bond stress then began to decrease, reaching residual value at high values of slip.
3 Modeling of Bond Stress–Slip Relationships
3.1 Equivalent Age
To evaluate the effect of varying temperature and time upon the development of concrete compressive strength, a maturity method has been suggested by McIntosh (1949), Nurse (1949), and Saul (1951) regarding accelerated curing methods. Based on their ideas, the Nurse–Saul maturity function in Eq. (1) was suggested; this equation sums temperature and time intervals during the curing period to yield the maturity index, also called the temperature–time factor.
where M is the maturity index in °C h or °C day, T is the average concrete temperature in °C during the time interval Δt, T o is the datum temperature, usually taken to be −10 °C, t is the elapsed time in h or days, and Δt is the time interval in h or days.
Soon after the introduction of Eq. (1), it was recognized that the linear approximation might not be reliable for wide ranges of temperature change. Freiesleben Hansen and Pedersen (1977) suggested a new function to calculate a temperature–time factor from a history of curing concrete temperature; this function was derived from the Arrhenius rate theory (Brown and LeMay 1988), which is used to consider the effects of curing temperature upon the chemical reaction rate. This function is given in Eq. (2) and gives a quantity termed the equivalent age of concrete (t e in h).
where E is the apparent activation energy (J/mol), R is the universal gas constant (8.3144 J/mol/K), and T r is the absolute reference temperature in °C.
The development of the equivalent age function overcame one of the major limitations of the Nurse–Saul maturity function by providing a nonlinear function to describe the initial rate of development of concrete compressive strength and curing temperature. Although both Eqs. (1) and (2) were suggested in ASTM C1074-11 (2011), comparative research has shown that the latter is superior to the Nurse–Saul function (Byfors 1980; Carino 1982).
Equation (2) converts the actual concrete age to its t e at the reference temperature, T r . In the present study, the reference temperature was taken as the measured ambient temperature of 20 °C. The value of E was taken as 44,072 J/mol, which is in the range of the value suggested in ASTM C1074-11 (2011). In Table 1, the values of t e calculated from Eq. (2) are listed for all specimens; these values ranged between 7.8 and 85.2 h at T r . Figure 6a illustrates the relationships between the actual elapsed time (t in h) and t e .

Development of concrete strength at different t e . a The relationships between real elapsed time and t e and b prediction of concrete strength S at different t e .
3.2 Development of Concrete Compressive Strength
A mathematical model of the rate of relative increase in concrete compressive strength with respect to its limiting compressive strength (S u MPa) was suggested by Bernhardt (1956) as given in Eq. (3). In Eq. (3), the positive-valued reaction coefficient r reflects the retardation of continuous hydration as curing elapses. Equation (3) assumes that the rate of strength increase relative to S u decreases from the rate constant (k) to zero as the strength (S) approaches S u during continued curing.
Depending upon the type of concrete, curing conditions, or experimental parameters under consideration, various modifications of Eq. (3) have been suggested (Yi et al. 2005; Carino and Tank 1992; Kim et al. 1998, 2001; Kwon et al. 2014). Bernhardt (1956) and Carino (1984) suggested the use of r = 2 after empirically investigating the development of strength in ordinary concrete exposed to various curing temperatures. As an extension of the basic equation (3) with r = 2, Tank and Carino (1991) proposed the rate constant model given in Eq. (4) to estimate the relative strength gain of concrete based upon its t e .
where k r is the rate constant (h−1) at the reference temperature, T r , S u is the ultimate strength of concrete, and t or (h) is the age at the start of strength development at the reference temperature.
Based upon the measured value of concrete compressive strength (\( f_{ct}^{\prime} \)) and the corresponding calculated values of t e , regression analysis was performed to find the best-fitting values of t or , k r and S u in Eq. (4); these were respectively determined to be 4.99 h, 0.0149 h−1 and 41.3 MPa. Equation (4) was able to predict the development of concrete strength in terms of t e with reasonable accuracy (Fig. 6b). The average and standard deviation of the ratios of the concrete strength predicted by Eq. (4) to the measured one were 0.99 and 0.12, respectively (Table 2).
3.3 Bond Stress–Slip Relationships of Strands
In the experiments, similar pull-out behavior was observed for the strands embedded in concrete under the various curing conditions and for deformed rebar in concrete at the 28-day curing condition (Fig. 4). Therefore, the model given in Eq. (5) was adopted in the present study for modeling the bond stress–slip relationships of the strands after curing under various conditions. It is worth noting that Eq. (5) was suggested for the modeling of bond stress–slip relationships for a deformed steel bar embedded in concrete at 28 days of curing (fib model code 2013); thus, the compressive strength given in this equation is independent of t e .
As observed in pull-out tests, the model consists of four different branches: an increasing curvilinear part followed by a constant part at maximum bond stress, a linearly decreasing part, and a constant tail part indicating the frictional bond resistance.
where τ b , τ max and τ f are respectively the bond stress at slippage s, the maximum bond stress, and the frictional bond stress (MPa), and s, s 1, s 2 and s 3 are respectively the slippage, the slippage at characteristic point (1), the slippage at characteristic point (2) and the slippage at characteristic point (3) (mm). In Eq. (5), the value α b (0 ≤ α b ≤ 1) determines the degree of convexity of the initial ascending curve in bond stress–slip relationships.
Based upon the pull-out tests shown in Fig. 5, the pull-out model illustrated in Fig. 7 was used in the present study. For this model, three characteristic points [(1)–(3) in Fig. 7] are determined based upon the empirically observed stress–slip relationships for each specimen: two characteristic bond stresses (τ max for the maximum bond stress and τ f for the frictional bond stress), three characteristic slip values (s 1 for slip at τ max, s 2 at the end of the plateau with τ max and s 3 at the initiation of τ f ), and the curve parameter (α b ).

Modeling of the bond stress–slip relationships for the strand in the concrete at different t e .
It has been reported that, in general, characteristic slip values are independent of the diameter of the reinforcement and the compressive strength of 28-day air-cured concrete (fib model code 2013). Similarly, Fig. 5 also shows that the characteristic slip values vary only marginally between different specimens with different concrete strengths or different t e . The values of τ max and τ f , however, seemed to be influenced by the concrete strength and thus by t e at the time of the pull-out test.
Three characteristic slip values were determined from the average values of test results obtained from the same t e . However, it is worth mentioning that these values were repeatedly calibrated with other characteristic and parametric values in order for the bond-slip model to better predict the overall bond-slip relationships observed from the test results. Regression analysis was performed to determine the relationships between each of the characteristic values of slip and t e . Linear regression analysis of 12 measurements collected at the characteristic points tested in this study yielded the best-fit line given in Eq. (6):
Figure 8a illustrates the comparisons between the measured characteristic slip values and those predicted by Eq. (6). The averages and standard deviations of the ratios of the Eq. (5) predictions to the experimentally observed slip values were 1.05 and 0.25, 1.01 and 0.12, and 1.02 and 0.13 for s 1, s 2 and s 3, respectively (Table 2).

Model parameters as functions of t e . a Slip values at characteristic points, b value of η as a function of t e and c value of αb as a function of t e .
The test results showed that the magnitudes of τ max and τ f were influenced by the developed concrete strength, as indicated by the different values of t e . Also, the value of τ f seemed to be dependent upon the τ max value. Accordingly, Eq. (7) was used to approximate the τ max and τ f as functions of t e .
where η is a coefficient representing the bond condition and ν is a coefficient representing the frictional bond resistance.
Using the measured values of τ max and \( f_{ct}^{\prime} , \) 12 values of the coefficient η were calculated for each specimen based on Eq. (7a) and listed in Table 1. As illustrated in Fig. 8b, these values were observed to be almost linearly proportional to t e . Based on this observation, Eq. (8) was developed to express η as a linear function of t e . Equation (8) limits the maximum value of η to 2.5 because this value expresses good bond condition in well-confined concrete (fib model code 2013).
The average and standard deviation of the ratios of the model predictions by Eq. (7a) to the experimentally observed values of τ max were 1.01 and 0.20, respectively. It is worth noting that the measured value of \( f_{ct}^{\prime} \) from specimen P4A was 1.8 MPa, which was about 62% less than the 2.9 MPa measured for its replicate specimen P4B. The tests were performed at t = 4 h (or t e = 7.8 h) and difficulties were involved in measuring bond stress–slip relationships accurately for these immature specimens.
Based on Eq. (7b) and the measured values of of τ max and τ f , the coefficient of frictional bond stress (ν) was obtained and tabulated in Table 1. The average value of 0.75 was taken as the value of ν. The average and standard deviation of the ratios of the Eq. (7b) model predictions to the measured values of τ f were 1.04 and 0.28, respectively.
The initial ascending curves in the bond stress–slip relationship became increasingly convex upward for increasing values of t e (Fig. 5). However, the degree of this increase was reduced with increasing t e , and the curves were nearly the same for t e of 8 h or greater. This was reflected in the function for α b , in which α b decreases exponentially from 1.0 and approaches 0.16 asymptotically at large t e . Based on the test results, the values of α b were estimated based on Eq. (5a). From the regression analysis on these values, Eq. (9) was then suggested to express α b as a function of t e . Equation (9) closely predicted the experimentally obtained values of α b (Fig. 8c).
The average and standard deviation of the ratios of predicted values of α b to the observed ones were 1.03 and 0.20, respectively (Table 2).
3.4 Comparisons Between Model Predictions and Test Results
The model predictions were compared to the measured bond stress–slip relationships of the strand pull-out at different curing conditions having different values of t e (Fig. 9). In general, the model was able to predict the overall bond stress–slip relationships obtained from the pull-out tests.

Comparisons between model predictions and test results on bond stress–slip relationships.
Because the thermal loss of the strand in pretensioned prestressed concrete members during steam curing is directly related to the bond conditions between the strand and the surrounding concrete, the model developed herein can be a useful tool in theoretically assessing the thermal prestress loss of strand during the curing at elevated temperature.
In this study, pull-out tests at elevated temperatures were performed for different t e s with its maximum value of 85.2 h. According to Barr et al. (2005), thermal prestress loss occurs approximately within the range of 6–10 h in real time after casting. This would correspond to t e between 44 and 100 h at a typical curing regime of 3–6–3 h with maximum temperature of 60 °C. Equation (6) shows that the values of s 1 and s 2 become identical at t e equal to 300 h, which seems to be far beyond the approximate maximum t e of 100 h at bonding. However, the developed bond-slip model presented herein is recommended for its application to the case when the formation of sufficient bonding is expected to occur before the approximate upper bound of 100 h in equivalent age.
4 Conclusions
Relationships of bond stress versus slip were experimentally observed by means of pull-out tests of strands embedded in concrete under various curing conditions, and were then modeled as a function of equivalent age. The following conclusions were drawn from this study.
-
(1)
Regardless of the elapsed time of steam curing, all measured bond-slip relationships exhibited four distinctive regions: a prepeak curvilinear ascending region, a near constant region at peak stress, and a gradually descending region followed by a region of constant frictional bond resistance.
-
(2)
Bond strength and initial stiffness tended to increase with increasing equivalent age. In particular, the prepeak ascending curve in the bond stress–slip relationships tended to become more convex with increasing equivalent age.
-
(3)
The stresses τ max and τ f were influenced by t e at the time of the pull-out test. Both τ max and τ f were observed to increase proportionally to the product of a linearly increasing function of equivalent age and the square root of concrete strength.
-
(4)
The characteristic slip values varied only marginally between different specimens with different concrete strengths or different t e . This observation conforms with the observation made for a deformed bar pulled out from 28-day air-cured concrete.
-
(5)
In general, the empirical bond stress–slip model developed based upon the equivalent age reasonably predicted the local bond stress–slip relationships of seven-wire strands embedded in concrete under various curing conditions.
-
(6)
In future study, the developed model can be used for a tool for predicting the time of bonding between the strand and the surrounding concrete at various curing conditions.
References
Ahlborn, T. M., French, C. E., & Shield, C. K. (2000). High-strength concrete prestressed bridge girders: Long term and flexural behavior. University of Minnesota Digital Conservancy.
ASTM C1074-11. (2011). Standard practice for estimating concrete strength by the maturity method. ASTM International.
Barr, P. J., Stanton, J. F., & Eberhard, M. O. (2005). Effects of temperature variations on precast, prestressed concrete bridge girders. Journal of Bridge Engineering, 10(2), 186–194.
Bernhardt, C. J. (1956). Hardening of concrete at different temperatures. In RILEM symposium on winter concreting. Session B-II. Copenhagen: Danish Institute for Building Research.
Brown, T. L., & LeMay, H. E. (1988). Chemistry: The central science (4th ed., pp. 494–498). Englewood Cliffs, NJ: Prentice Hall.
Bruce, R. N., Russell, H. G., Roller, J. J., & Hassett, B. M. (2001). Implementation of high performance concrete in Louisiana bridges. Report No. 310. Baton Rouge, LA: Louisiana Transportation Research Center.
Byfors, J. (1980). Plain concrete at early ages. No. 80 (p. 464). Swedish Cement and Concrete Research Institute.
Campione, G., Cucchiara, C., La Mendola, L., & Papia, M. (2005). Steel–concrete bond in lightweight fiber reinforced concrete under monotonic and cyclic actions. Engineering Structures, 27(6), 881–890.
Carino, N. J. (1982). Maturity functions for concrete. In Proceedings of RILEM international conference on concrete at early ages, Paris (Vol. 1, pp. 123–128). Paris: Ecole Nationale des Pontset Chausses.
Carino, N. J. (1984). Maturity method: Theory and application. Journal of Cement Concrete and Aggregates, 6(2), 61–73.
Carino, N. J., & Tank, R. C. (1992). Maturity functions for concretes made with various cements and admixtures. ACI Materials Journal, 89(2), 188–196.
Choi, K. B. (1988). Anchorage of beam reinforcement at conventional and fibrous beam–column connection. PhD Dissertation, Michigan State University, East Lansing, MI.
Eligehausen, R., Popov, E. P., & Bertero, V. V. (1983a). Local bond stress–slip relationships of deformed bars under generalized excitations (pp. 69–80). Berkeley, CA: University of California.
Eligehausen, R., Popov, E. P., & Bertero, V. V. (1983b). Local bond stress–slip relationships of deformed bars under generalized excitations. Report UCB, EERC-83/23. Berkeley, CA: Earthquake Engineering Research Center, University of California.
Erkmen, B., Shield, C. K., & French, C. E. (2008). Self-compacting concrete (SCC) for prestressed bridge girders. University of Minnesota Digital Conservancy.
European Committee for Standardisation, CEN. (2004). Eurocode 2: Design of concrete structures—Part 1-1: General rules and rules for buildings. European Standard, EN 1992-1-1:2004:E. Brussels: CEN.
Freiesleben Hansen, P., & Pedersen, J. (1977). Maturity computer for controlled curing and hardening of concrete. Nordisk Betong, 1, 19–34.
Freyssinet, E. (1954). The birth of prestressing. Public translation. London: Cement and Concrete Association.
Huang, T. (1980). Estimation of prestress loss in concrete bridge members. Fritz Engineering Laboratory Report No. 402.4. Lehigh University.
Jeon, S. J., Park, S. Y., Kim, S. H., Kim, S. T., & Park, Y. (2015). Estimation of friction coefficient using smart strand. International Journal of Concrete Structures and Materials, 9(3), 369–379.
Kim, S. J., Kim, J. H. J., Yi, S. T., Noor, N. B. M., & Kim, S. C. (2016). Structural performance evaluation of a precast PSC curved girder bridge constructed using multi-tasking formwork. International Journal of Concrete Structures and Materials, 10(3), 1–17.
Kim, J. K., Moon, Y. H., & Eo, S. H. (1998). Compressive strength development of concrete with different curing time and temperature. Cement and Concrete Research, 28(12), 1761–1773.
Kim, T. H., Seong, D. J., & Shin, H. M. (2012). Seismic performance assessment of hollow reinforced concrete and prestressed concrete bridge columns. International Journal of Concrete Structures and Materials, 6(3), 165–176.
Kwon, S. H., Jang, K. P., Bang, J. W., Lee, J. H., & Kim, Y. Y. (2014). Prediction of concrete compressive strength considering humidity and temperature in construction of nuclear power plants. Nuclear Engineering and Design, 275, 23–29.
Lu, L., Tadepalli, P. R., Mo, Y. L., & Hsu, T. T. C. (2016). Simulation of prestressed steel fiber concrete beams subjected to shear. International Journal of Concrete Structures and Materials, 10(3), 297–306.
McIntosh, J. D. (1949). Electrical curing of concrete. Magazine of Concrete Research, 1(1), 21–28.
Missouri University of Science and Technology. (2012). Self‐consolidating concrete (SCC) for infrastructure elements: Bond behavior of mild reinforcing steel in SCC. Report cmr 13-003. Rolla, MO: Missouri Department of Transportation Construction and Materials.
Naaman, A. E., & Alkahiri, F. M. (1991). Stress at ultimate in unbonded tendons—Part I: Evaluation of the state-of-the-art. ACI Structural Journal, 89(5), 641–651.
Newhouse, C., & Wood, T. (2008). The effect of temperature on the effective prestressing force at release for PCBT girders. In Structures congress 2008: Crossing borders (ASCE) (pp. 1–10).
Nurse, R. W. (1949). Steam curing of concrete. Magazine of Concrete Research, l(2), 79–88.
RILEM 7-II-128. (1994). RC6: Bond test for reinforcing steel. 1. Pull-out test. RILEM technical recommendations for the testing and use of construction materials (pp. 102–105). London: E and FN Spon.
Rizkalla, S., Zia, P., & Storm, T. (2011). Predicting camber, deflection, and prestress losses in prestressed concrete members. No. FHWA/NC/2010-05 (pp. 10–22). North Carolina Department of Transportation Research and Analysis Group.
Roller, J. J., Russell, H. G., Bruce, R. N., & Hassett, B. (2003). Effect of curing temperatures on high strength concrete bridge girders. PCI Journal, 48(2), 72–79.
Saul, A. G. A. (1951). Principles underlying the steam curing of concrete at atmospheric pressure. Magazine of Concrete Research, 2(6), 127–140.
Singh, B. P., Yazdani, N., & Ramirez, G. (2013). Effect of a time dependent concrete modulus of elasticity on prestress losses in bridge girders. International Journal of Concrete Structures and Materials, 7(3), 183–191.
Tadros, M. K. (2003). Prestress losses in pretensioned high-strength concrete bridge girders. Transportation Research Board, 496, 5–55.
Tank, R. C., & Carino, N. J. (1991). Rate constant functions for strength development of concrete. ACI Materials Journal, 88(1), 74–83.
The International Federation for Structural Concrete, fib. (2013). fib model code for concrete structures 2010. Lausanne: fib.
Yi, S. T., Moon, Y. H., & Kim, J. K. (2005). Long-term strength prediction of concrete with curing temperature. Cement and Concrete Research, 35(10), 1961–1969.
Acknowledgements
This Research was supported by the Basic Science Research Program through the National Research Foundation of Korea (NRF) funded by the Ministry of Education, Science and Technology (NRF-2013R1A2A2A01011563) and by the Chung-Ang University Graduate Research Scholarship in 2016.
Author information
Authors and Affiliations
Corresponding author
Rights and permissions
Open Access This article is distributed under the terms of the Creative Commons Attribution 4.0 International License (http://creativecommons.org/licenses/by/4.0/), which permits unrestricted use, distribution, and reproduction in any medium, provided you give appropriate credit to the original author(s) and the source, provide a link to the Creative Commons license, and indicate if changes were made.
About this article

Cite this article
Lee, C., Shin, S., Lee, S. et al. Modeling of Bond Stress–Slip Relationships of a Strand in Concrete during Steam Curing. Int J Concr Struct Mater 11, 477–487 (2017). https://doi.org/10.1007/s40069-017-0210-y
Received:
Accepted:
Published:
Issue Date:
DOI: https://doi.org/10.1007/s40069-017-0210-y