- Original article
- Open access
- Published:
Experimental and Analytical Studies of U-Shaped Thin-Walled RC Beams Under Combined Actions of Torsion, Flexure and Shear
International Journal of Concrete Structures and Materials volume 12, Article number: 33 (2018)
Abstract
U-shaped thin-walled concrete bridge beams usually suffer the combined actions of flexure, shear and torsion, but no research about the behavior of U-shaped thin-walled RC beams under combined actions has been reported in literature. Three large specimens of U-shaped thin-walled RC beams were tested under different torque–bending moment ratios (T–M ratios) of 1:5, 1:1 and 1:0 to investigate the mechanical responses such as crack patterns, reinforcement strains, failure modes and ductility. The testing results showed that ductile flexural failures occurred for all three of the U-shaped thin-walled beam specimens, although the combined shear effect of circulatory torque, warping torque and shear force increased as the T–M ratio increased from 1:5 via 1:1 to 1:0, reflected by diagonal cracks and stirrup strains. More specifically, basically symmetrical flexural failure was dominated by the bending moment when the T–M ratio was 1:5; flexural failure of the loaded half of the U-shaped thin-walled section was dominated by the combined action of the bending moment and warping moment, while there were only a few cracks on the other half of the U-shaped section when the T–M ratio was 1:1; and anti-symmetrical flexural failure was dominated by the warping moment when the T–M ratio was 1:0 (pure torsion). A simple method to calculate the ultimate load of such U-shaped thin-walled RC beams under different T–M ratios was suggested, and the calculating results were corresponding well with the experimental results.
1 Introduction
U-shaped thin-walled reinforced concrete (RC) bridge beams have been widely used in urban construction of rail viaducts in China, such as in Shanghai Subway Line 6 and Guangzhou Subway Line 2, due to the advantage of lower construction elevations, the excellent sound proof effect and attractive appearance (He 2003). Under normal service conditions, this type of member is typically subjected to the combined action of bending, shear and torsion due to eccentric traffic load (especially in multilane cases and curved structure cases) and transverse wind load. However, according to the authors’ knowledge, no research about the mechanical response of such U-shaped thin-walled RC members under combined actions has been reported in literature. The existing studies about the U-shaped thin-walled RC bridge beams are mainly concentrated on bending and shear. In China, the additional torsional effect is indirectly considered by improving the safety reserve in bending and shear design, which is unreasonable and uneconomical. Thus, the mechanical response of the U-shaped thin-walled RC beams under the combined action of bending, shear and torsion should be studied to lay the foundation for the development of a rational design provision.
The major difference in the mechanical mechanism between a member with an open thin-walled section and a member with a closed section is the torsional response. When a closed section member is under pure torsion, the warping effect is too weak to be neglected, thus only the well-known circulatory torsion, or St. Venant’s torsion, is considered. After a century of exploration, there are lots of achievements in research aimed at the torsional response of RC members with closed sections, and the widely applied theoretical model is the spatial softened truss model (Mitchell and Collins 1974; Hsu and Mo 1985; Vecchio and Collins 1986; Rahal and Collins 1995a, b, 2006; Jeng and Hsu 2009; Bernardo et al. 2012a, 2015). Basically, with specific revisions, it is applicable to all situations dominated by circulatory torsion, such as high strength concrete members (Bernardo et al. 2012b) and box section members (Bernardo et al. 2013; Jeng 2015; Wang et al. 2015). The softened truss model is also the theoretical model used to simulate the behavior of closed section concrete members under shear (planar softened truss model) (Vecchio and Collins 1981, 1986, 1988; Pang and Hsu 1995; Tadepalli et al. 2015; Liang et al. 2016) as well as under the combined actions of bending, shear and torsion (Rahal and Collins 2003; Rahal 2007; Greene and Belarbi 2009a, b).
As to torsional members with open thin-walled sections, the warping effect is not negligible. According to Vlasov’s elastic theory of the open thin-walled member (Vlasov 1961), when the warping deformation of an open thin-walled member under torsion is restrained, a new internal force called warping moment corresponding to warping normal stress will appear. When it occurs, two kinds of internal torque appears simultaneously, which are circulatory torque (the same as that in the closed section case) and warping torque. In 1961, Vlasov (1961) developed the sectorial coordinate system and derived the theoretical formula to calculate warping torque and warping moment for open thin-walled members, which became the basis for analyzing open thin-walled members under torsion. Thereafter, some research outcomes on the elastic torsional response of the open thin-walled member, especially focusing on the shear deformation induced by the warping torque, have been reported (Pavazza 2005; Erkmen and Mohareb 2006; Murín and Kutiš 2008; Aminbaghai et al. 2016). When it comes to the post cracking torsional behavior of RC members with an open thin-walled section, the above mentioned softened truss model for circulatory torsion is not accurate anymore because of the considerable warping effect (Luccioni et al. 1991). In addition the Vlasov’s elastic theory should be revised due to the cracking of concrete. Zbirohowski-Koscia (1968) first addressed issues related to the post-cracking behavior of open thin-walled RC beams under the warping moment. In 1981, Krpan and Collins tested the torsional response of a fixed–fixed U-shaped thin-walled RC beam (Krpan and Collins 1981a). The results confirmed the dominate role that the warping moment played. In the analogy to bending, based on Vlasov’s theory, the method to simulate the post cracking torsional behavior of the U-shaped thin-walled RC beam was proposed (Krpan and Collins 1981b). Then Hwang and Hsu (1983) analyzed the entire torsional behavior of the RC channel beam with a method from the Fourier series approach. In the following two decades, few research outcomes on the torsional behavior of open thin-walled RC members under torsion were reported in literature. Due to the wide application of U-shaped thin-walled RC beams in the construction of rail viaducts in recent years, their torsional behavior has again drawn research’s attention. Theoretical and experimental studies on the torsional behavior of U-shaped thin-walled RC beams have been carried out by our research group (Chen et al. 2016a, b), and based on Vlasov’s torsional theory and the nonlinear constitutive relations of materials, a nonlinear model to predict the torsional response of such U-shaped thin-walled RC beams has been proposed.
Research into the mechanical response of open thin-walled RC members under combined actions of bending, shear and torsion is quite rare. Analytical and experimental studies on the behavior of RC I-beams under combined bending, shear and torsion were conducted by Luccioni et al. (1991, 1996), and a calculation method of ultimate load based on the skew bending theory (Elfgren et al. 1974) was proposed, where the skew bending theory was modified by taking warping torque into account. In the calculation method, the effect of the warping moment was neglected because, due to the specific geometrical properties of the I-section, the effect of the warping moment was weak and ignorable compared to the effect of the bending moment. However, it is not the case for U-shaped thin-walled RC beams studied in this paper as the geometrical properties of the U-section will make the effect of the warping moment as strong as the bending moment.
Considering the strong warping effect in the U-sections, the interaction results of bending moment and warping moment, as well as the interaction results of circulatory torque, warping torque and shear force should be experimentally studied. In the current paper, considering the variation of the torque–bending moment ratio (T–M ratio) in practice, three large U-shaped thin-walled RC beam specimens will be respectively tested under different T–M ratios of 1:5, 1:1 and 1:0 to investigate the mechanical response. The crack pattern, reinforcement strain, failure mode and ductility will be analyzed. Finally, an approach of calculating the cracking load and the ultimate load of each kind of beam will be proposed, which will make meaningful contributions to developing design guidelines for U-shaped thin-walled RC beams subjected to combined bending, shear and torsion.
2 Experimental Plan
2.1 Testing Specimens
As shown in Fig. 1, three U-shaped thin-walled RC beam specimens of the same geometric size were designed based on the bridge beams used in the Nanjing No. 2 rail transit in China, with a reduced scale of 1:4. Since the width (900 mm) of the beam cross-section was 10 times larger than the wall thickness (70 mm) and the span length (6650 mm) of the beam was about 100 times the wall thickness, the studied beam specimens are thin-walled structures. The arrangement of reinforcements including longitudinal bars and stirrups were the same for all three beam specimens, which is shown in Fig. 1b. As shown in Fig. 1a, c, referring to the U-shaped thin-walled RC beam specimen designed by Krpan and Collins (1981a), large end diaphragms (solid blocks) with a thickness of 350 mm were provided to restrain the warping of the end cross sections. What is more, three pieces of steel plates were pre-embedded in the concrete (the bidirectional steel bars in the end diaphragm were welded to the steel plate) on the two sides and the top of each end diaphragm to restrain longitudinal displacement (elongation and shortening) of the end cross section, which will be further stated in Sect. 2.2. At mid-span, a strengthened diaphragm was set to prevent local failure. Chamfers of 1:1.125 were added at the internal intersections between the vertical webs and the bottom slab to avoid stress concentration.

Information of U-shaped thin-walled RC beam specimens (unit: mm). a Top view of U-shaped thin-walled RC beams, b detailed information of cross-Sect. 1-1, and c detailed information of cross-Sect. 2-2.
The U-shaped thin-walled RC beam specimens were cast in a factory of prefabrication and were moist cured by covering the surfaces with wet straw bags, with the temperature of about 20–24 °C for 60 days. Then they were moved into the lab for test preparation and at the age of 80–90 days, the beams were tested. Six concrete prism specimens (100 mm × 100 mm × 300 mm) were cast in situ for each beam specimen and cured under the same conditions as the beam specimens. Then the compression strength and elastic modulus of concrete for each beam was tested on the same day of the beam testing. The strength and modulus of elasticity of the reinforcing bars were also experimentally measured. The material properties of reinforcements and concrete are listed in Table 1.
2.2 Experimental Setup
As shown in Fig. 2a, the load was applied eccentrically at mid-span by a hydraulic jack acting on the loading frame, which was equivalent to the combined action of bending, shear and torsion. To make sure the beam ends were completely fixed, the end diaphragms of the beam were connected to the anchoring device by high-strength bolts to restrain the bending angle and rotation. What is more, as shown in Fig. 2a, the three pre-embedded steel plates at each end diaphragm were welded to the anchoring device to restrain longitudinal displacement (elongation and shortening). The anchoring device was fixed to the reaction floor by high-strength bolts. As shown in Fig. 2b, the three beam specimens were respectively tested under applied T–M ratios of 1:5, 1:1 and 1:0 (pure torsion); accordingly, the beam specimens were denoted as MEM-1:5, MEM-1:1 and MEM-1:0. The specific T–M ratios at the mid-span section for MEM-1:5 and MEM-1:1 were respectively achieved by adjusting lateral eccentricities, which are listed in Table 1. In the case of MEM-1:0 under pure torsion, the torque was applied by two jacks acting on the loading frame in opposite directions. In the rest of the paper, in order to describe the testing process conveniently, as shown in Fig. 2b for MEM-1:5 and MEM-1:1, the web near the vertical load was called loaded web and the other web, away from the vertical load, was called unloaded web. As to specimen MEM-1:0 under pure torsion, the web going down during the loading process was called loaded web and the web going up was called unloaded web. A picture of the loading condition of MEM-1:1 is shown in Fig. 2c.

Testing setup of U-shaped thin-walled beams (unit: mm). a Schematic diagram of testing setup, b loading information of test, specimens, and c loading condition of MEM-1:1.
2.3 Location of Potential Critical Sections
According to the theory (Vlasov 1961), under combined actions of bending, shear and torsion, the distributions of internal forces along the beam span, i.e. circulatory torque Tc, warping torque Tω, warping moment Mω, shear force V and bending moment Mb, and the distributions of corresponding stresses around the cross-section are shown in Fig. 3a and b, respectively. As shown in Fig. 3a, the maximum bending moment and warping moment (in magnitude) were located at support and mid-span; and the bending moment and warping moment at support, and those at mid-span are equal in magnitude while opposite in direction, respectively. Thus, the support and mid-span are normal stress critical sections. The maximum circulatory torque occurs at the L/4-section and the maximum warping torque appears at support and mid-span, considering that shear stress due to one-unit circulatory torque is much larger in magnitude than that due to one-unit warping torque. The shear stress resultant reaches the maximum at the L/4-section where the maximum circulatory torque was located. That is to say, the L/4-section is the shear stress critical section.

Internal forces and stress distributions under mixed torsion, shear and flexure. a Distributions of internal forces and b stress distributions induced by internal forces. a\( C = [{\text{ch}}(\alpha L/2) - 1]/[\alpha \cdot {\text{sh}}(\alpha L/2)], \) where \( \alpha = \sqrt {\frac{\text{circulatory\; torsional\; stiffness}}{\text{warping\; torsional\; stiffness}}}\).
As shown in Fig. 3b, normal stress due to warping moment Mω anti-symmetrically distributes around the cross-section, while normal stress due to bending moment Mb symmetrically distributes; therefore they enhance each other on the loaded half U-section while counteracting on the unloaded half U-section. Thus, for MEM-1:5 and MEM-1:1, under the combined actions of bending moment and warping moment, the loaded half U-section will be more critical than the unloaded half U-section. As shown in Fig. 3b, shear stresses due to circulatory torque, warping torque and shear force distribute differently around the cross-section, and they enhance one another on the external surface of the loaded web while they do not elsewhere. Therefore, under the combined actions of circulatory torque, warping torque and shear force, the external surface of the loaded web will be more critical than other surfaces of the U-section.
2.4 Arrangement of Measurement Points and Testing Procedure
Based on the elastic analysis results of the U-shaped thin-walled beam, the stress critical sections and critical points can be determined (details in Sect. 2.3). Considering the symmetry of the internal forces about mid-span (Fig. 3a), the west half-span of the beam specimen was used as a measuring span to collect testing data, while the east half-span of the beam specimen was used to observe the propagation of cracks and failure procedures. The two normal stress critical sections (i.e. support and mid-span sections) and the shear stress critical section (i.e., L/4-section) were selected to measure the data of reinforcement strains, displacement and rotation. Besides, the reinforcement strains at the L/8- and 3L/8-sections were also measured. As shown in Fig. 4, six measuring points of displacements (D1–D6), two measuring points of rotation (R1 and R2), twelve measuring points of longitudinal bar strains (L1–L12) and ten measuring points of stirrup strains (S1–S10) were arranged around each selected cross section. The strain gages were pre-arranged on steel bars. The loading jack used in the tests, Actuator-243.45, was controlled by an MTS electro-hydraulic servo-control system. The loading increment during the test was first set to 0.5 kN with a loading rate of 0.005 kN/s to capture the initiation of concrete cracks and then was increased to 2 kN with a loading rate of 0.015 kN/s. Once the longitudinal bars yielded, the vertical displacement of the jack was selected to control the loading step, with an increment of 1 mm at a loading rate of 0.03 mm/s. The experiment was terminated after the load reached the peak value and subsequently decreased to 85% of the ultimate load.

Arrangement of measuring points around the selected sections (unit: mm).
3 Test Results and Discussion
3.1 Failure Procedure
The characteristic loading values, i.e. flexural cracking, diagonal cracking, longitudinal steel bar yielding, stirrup yielding and their corresponding locations, as well as the ultimate load, are listed in Table 2, where the first yielding load was determined when the measured strain first reached the yielding strain. The crack patterns of the observed span of the three beam specimens are shown in Fig. 5, in which the numerical values are the corresponding external torques, and the bordered ones are first flexural cracking torques (the smaller one) or first diagonal cracking torques (the larger one). The photos of failure modes of the loaded web at mid-span of the three beams are shown in Fig. 6. As shown in Table 2, Figs. 5 and 6, for all three beam specimens, the first cracking, the first yielding of reinforcement steel bars and the flexural failure occurred at support and mid-span (normal stress critical sections). Compared to Fig. 3b, the corresponding location of flexural cracking and longitudinal bar yielding were corresponding well with the location where the maximum tensile normal stress resultant occurs (i.e., for MEM-1:5 and MEM-1:1, on the top of the loaded web at support; for MEM-1:0, on the top of the loaded web at support and on the top of the unloaded web at mid-span). In addition, the location of concrete crushed is in accordance with the location where the maximum compressive normal stress resultant occurs, (i.e., for MEM-1:5 and MEM-1:1, on the top of the loaded web at mid-span; for MEM-1:0, on the top of the loaded web at mid-span and on the top of the unloaded web at support). Those indicate that the flexural failure modes of U-shaped thin-walled RC beams for different T–M ratios (further discussed in Sect. 3.4) were dominated by the combined actions of warping moment and bending moment. The torque–rotation and bending moment-deflection curves of beam specimens at mid-span are shown in Fig. 7a and b, respectively (details in Sect. 3.2). It can be seen from Fig. 7 and Table 2 that, with the increase of the T–M ratio from 1:5 to 1:0, for every characteristic loading state, the corresponding torque increased while bending moment decreased. With the increase of the T–M ratio from 1:5 to 1:1, the ultimate torque increased from 34.8 to 92.0 kNm by 164%, while the corresponding ultimate bending moments dropped from 174.0 to 92.0 kNm by 47%; and with the T–M ratio from 1:1 to 1:0, without bearing bending moment, the ultimate torque of MEM-1:0 reached 147.0 kNm and was 60% higher than that of MEM-1:1 (92.0 kNm). That means that torque significantly weakened the flexural bearing capacity of the U-shaped thin-walled RC beam, and vice versa. In other words, the combined action of bending moment and restrained torsion obviously influenced the ultimate bearing capacities of the U-shaped thin-walled RC beam. Nevertheless, as shown in Table 2, the load percentages of the flexural cracking and the yielding of longitudinal bars of the three beam specimens are about 11–13 and 57–60%, respectively, which means that the combined effects of bending, shear and torsion on these two characteristic factors seems similar. As shown in Table 2, with the T–M ratio increasing from 1:5 via 1:1 to 1:0, the diagonal cracking torque was reduced from 49 via 33 to 24% of the ultimate torque; and the first diagonal crack in MEM-1:5 and MEM-1:1 was flexural-shear type initiating at the 3L/8-section and 5L/16-section, respectively, while the first diagonal crack in MEM-1:0 was a web-shear type initiated at the L/4-section. For the whole loading process, no stirrups yielded in MEM-1:5 and MEM-1:1 while stirrups yielded in MEM-1:0. Those indicated that the combined shear effect of circulatory torque, warping torque and shear force (or the effect of shear stress resultant) increased. What is more, compared with Fig. 3b, the first diagonal cracking and stirrup yielding occurred on the external surface of the loaded web where the maximum shear stress resultant exists.

Crack patterns of three beam specimens: a MEM-1:5, b MEM-1:1, and c MEM-1:0. aThe “ESBS” means “External Surface of Bottom Slab”, where the first two letters “ES” means “External Surface,” and the last two letters “BS” means “Bottom Slab.” As to other abbreviations, the first two letters “IS” means “Internal Surface,” the last two letters “LW” and “UW” mean “Loaded Web” and “Unloaded Web,” respectively.

Failure models of beam specimens at mid-span: a MEM-1:5, b MEM-1:1, and c MEM-1:0.

Torque–rotation and bending moment–deflection curves of beam specimens at mid-span: a rotations and b deflections.
3.2 Rotations, Deflections and Ductility
The mid-span torque–rotation curves of the three beam specimens and the torque–deflection curves of MEM-1:5 and MEM-1:1 (MEM-1:0 was under pure torsion) were shown in Fig. 7. The rotation of the beam specimen was the average value of rotations of the loaded web, unloaded web and bottom slab. Taking the calculation method of the loaded web rotation as an example, it is calculated from (D6 – D5)/Δ, where D6 and D5 are the testing data of horizontal displacement meters shown in Fig. 4, and Δ is the distance between them. The deflection is calculated by [(D5 + D4)/2]mid-span − [(D3 + D4)/2]support, where D3 and D4 are testing data of vertical displacement meters at the bottom of the two webs, taking the direction of loading as positive. As shown in Fig. 7, with the increase of the T–M ratio, the rotations at mid-span corresponding to the ultimate torques increase while the deflections at mid-span decrease. According to the rotation curves, the ductility coefficient (ratio between the rotation corresponding to the torque decreased to 85% of the ultimate torque and the rotation corresponding to the first yielding of reinforcement) can be calculated, and the ductility coefficient can also be calculated from deflection curves. The results were summarized in Table 3. As shown in Table 3, for MEM-1:5 and MEM-1:1 the rotational ductility coefficient is basically equal to the deflection ductility coefficient. It can also be seen from Table 3 that the three beam specimens had similar rotational ductility coefficients, and for MEM-1:5 and MEM-1:1, they had similar deflection ductility coefficients. All three beams under different T–M ratios showed good ductile performance. That was because the failure modes of the three beam specimens were ductile flexural failure, which will be further discussed in Sect. 3.4.
3.3 Crack Patterns
The crack patterns of the observed span of the three beam specimens are shown in Fig. 5, in which the numerical values are the corresponding external torques, and the bordered ones are first flexural cracking torques (the smaller ones) or first diagonal cracking torques (the larger ones). It can be seen from Fig. 5 that, for the three beam specimens, the cracks at support and mid-span are mainly vertical flexural types, displaying small shear features, which means at support and mid-span, warping moment and bending moment predominate while shear force and warping torsion had little influence. Cracks at the L/4-section are diagonal types with an inclination of about 45°. The distributions of cracks along the beam span conform well to the distributions of internal forces shown in Fig. 3a. For MEM-1:5, flexural cracks on the loaded web were more fully developed than those on the unloaded web; for MEM-1:1, flexural cracks were fully developed on the loaded web but only a few flexural cracks appeared on the unloaded web; for MEM-1:0, flexural cracks anti-symmetrically developed on two webs. The different development of flexural cracks on two webs of each beam was attributable to the interaction of the bending moment and warping moment under different T–M ratios, which will be discussed in detail in the following section. As to diagonal cracks, for MEM-1:5 and MEM-1:1, they developed most fully on the external surface of the loaded web; for MEM-1:0, they developed most fully on the external surfaces of the loaded and unloaded webs. That agrees with the distribution of shear stress resultant around the U-section (Sect. 2.3). Overall, with the increase of the T–M ratio from 1:5 via 1:1 to 1:0, diagonal cracks were more and more fully developed, which means the effect of shear stress resultant increased.
3.4 Failure Modes
According to the distributions of internal forces shown in Fig. 3a, two kinds of failure modes might occur, i.e. flexural failure occurs at normal stress critical sections or shear failure occurs at shear stress critical sections. The photos of ductile flexure failure modes of the loaded web at mid-span are shown in Fig. 6, and corresponding to the failure state, the photos of crack patterns on the external surface of the loaded web at the L/4-section are also shown in Fig. 8. As shown in Figs. 6 and 8, for the three beam specimens under different T–M ratios, typical ductile flexural failure occurred on the loaded web at mid-span, while at the L/4-section, more and more diagonal cracks were observed with the increase of the T–M ratio from 1:5 via 1:1 to 1:0; however no crushing of concrete appears. What is more, for MEM-1:5 and MEM-1:1, referring to Fig. 5, since the concrete crushing appears on the loaded web only, the loaded web was more critical than the unloaded web. In the following paragraphs, the failure modes will be further studied based on the reinforcement strains at these potential critical sections.

Photos of external surface of loaded web at L/4-span at ultimate state: a MEM-1:5, b MEM-1:1, and c MEM-1:0.
The longitudinal bar strains and stirrup strains at mid-span and the L/4-section of MEM-1:5, MEM-1:1 and MEM-1:0 are shown in Figs. 9, 10 and 11, respectively. For MEM-1:5 and MEM-1:1, as shown in Figs. 9 and 10, respectively, at the ultimate state, longitudinal bars at mid-span got very large strains up to ultimate strain both in tension and in compression, while longitudinal bars and stirrups at the L/4-section did not reach yield strain, which confirms that flexural failure occurred while shear failure did not. For MEM-1:0, as shown in Fig. 11a, at the ultimate state, longitudinal bars at mid-span also got very large tensile and compressive strains up to ultimate strain, which confirms that flexural failure occurred. As to the L/4-section, as shown in Fig. 11c, d, at the ultimate state, one longitudinal bar and portion of stirrups reached yield strain. Nevertheless, it can be also seen from Fig. 11c, d that the longitudinal bar strains and stirrup strains at the L/4-section were very small when the torque was less than the first yielding torque of the longitudinal bar at the support (i.e. 88.2 kNm), and thereafter the strains increased rapidly. That is to say, the effect of shear stress at the L/4-section was much weaker than the effect of normal stress at mid-span and support. The shear failure won’t occur.

Reinforcement strains of MEM-1:5. a Longitudinal bars strains at mid-span, b stirrup strains at mid-span, c longitudinal bars strains at quarter span, and d stirrup strains at quarter span. aThe “LW” and “UW” mean “Loaded Web” and “Unloaded Web,” respectively.

Reinforcement strains of MEM-1:1. a Longitudinal bars strains at mid-span, b stirrup strains at mid-span, c longitudinal bars strains at quarter span, and d stirrup strains at quarter span. aThe “LW” and “UW” mean “Loaded Web” and “Unloaded Web,” respectively.

Reinforcement strains of MEM-1:0. a Longitudinal bars strains at mid-span, b stirrup strains at mid-span, c longitudinal bars strains at quarter span, and d stirrup strains at quarter span. aThe “LW” and “UW” mean “Loaded Web” and “Unloaded Web,” respectively.
As flexural failure occurred for all the three beam specimens, more attention should be paid to mid-span and support. It can be seen from Fig. 9a that for MEM-1:5, longitudinal bar strains in the loaded half U-section (red lines) were larger than those in the unloaded half U-section (black lines); and from Fig. 10a, for MEM-1:1, longitudinal bars in the loaded half U-section got very large strains while those in the unloaded half U-section got small strains. In addition, from Fig. 11a for MEM-1:0, longitudinal bars in the loaded and unloaded half U-sections got basically equal strains. To clarify, the distributions of measured longitudinal bar strains around the mid-span cross section at first yielding load are shown in Fig. 12. It can be seen from Fig. 12a that for MEM-1:5, the loaded and unloaded half U-sections are bent in the same direction, and longitudinal bars in the loaded half U-section got larger strains than those in the unloaded half U-section. That is to say, for MEM-1:5, the vertical cracks, longitudinal bar strains and flexural failure were dominated by the bending moment, and the effect of the small warping moment made the loaded half U-section a bit more critical than the unloaded half U-section. As can be seen from Fig. 12b for MEM-1:1, longitudinal bars in the loaded half U-section got very large strains while strains of longitudinal bars in the unloaded half U-section were small. That indicates that the vertical cracks, longitudinal bar strains and flexural failure were dominated by a combined action of bending moment and warping moment, and after the interaction of warping normal stress and bending normal stress of basically equal magnitude, the normal stress resultant on the loaded half U-section was large while that on the unloaded half U-section was small. For MEM-1:0 shown in Fig. 12c, the two webs of the U-shaped section were bent under the warping moment. The vertical cracks, longitudinal bar strains and flexural failure were dominated by the warping moment. It is worthwhile mentioning that for the U-shaped thin-walled RC beam under pure torsion tested by Krpan and Collins (1981a), although the final failure of the beam specimen was initiated by the unexpected anchorage failure of the longitudinal bar, there was no doubt that the failure was also dominated by the warping just like MEM-1:0, with flexural cracking at mid-span and support ahead of diagonal cracking at L/4, as well as yielding of the longitudinal bar at mid-span and support ahead of stirrup yielding at L/4.

Distributions of measured longitudinal bar strain around mid-span cross-section: a MEM-1:5, b MEM-1:1, and c MEM-1:0.
It can be also seen from Fig. 12 that for the three beam specimens, longitudinal bar strains changed in a linear fashion around the U-shaped section, which agrees with the distribution of normal stresses induced by the bending and warping moment.
4 Method to Calculate the First Cracking Load and the Ultimate Load
A method to calculate the first cracking (i.e. flexural cracking) load and the ultimate load of the U-shaped thin-walled RC beams under combined actions of torsion, bending and shear will be suggested here. Considering the experimental results that, for all three beam specimens under different T–M ratios, the ductile flexural failure was dominated by the warping moment and bending moment at mid-span and at support, and the shear action (combined shear action of shear force and torque) at mid-span and at support is very weak and negligible. This was reflected by the extremely small stirrup strains at mid-span shown in Figs. 9b, 10b and 11b; thus the algorithm is measured by the normal stresses caused by the warping moment and bending moment at support and mid-span, where the shear effect is neglected.
4.1 Calculation of the Flexural Cracking Load
At support or at mid-span, the concrete would crack when the normal stress resultant of bending normal stress σb and warping normal stress σω exceeded the tensile strength of concrete, i.e. \( 0.63\sqrt {f_{c}^{{\prime }} ({\text{MPa}})} \) (318 2014). As stated in Sect. 3.1, referring to Fig. 3b, for MEM-1:5 and MEM-1:1, the maximal normal stress resultant is located on the top of the loaded web at support, and for MEM-1:0, the maximal normal stress resultant is located on the top of the loaded web at support and on the top of the unloaded web at mid-span. Considering the beam flexural theory, the maximum normal stress by the bending moment can be obtained:
where I is the moment of inertia and y is the distance from the neutral axis to the maximum tensile stress point. Based on the theory (Vlasov 1961), when a fixed–fixed open thin-walled member is subjected to a concentrated torque T at mid-span, the warping moment Mω(z) along the beam span can be obtained by:
where L is the span length, \( \alpha = \sqrt {GK/E_{c} I_{\upomega \upomega } } \) is the cross-sectional stiffness ratio between circulatory torsion and warping torsion, E c is the elastic modulus of concrete, G is the concrete shear modulus taken as 0.4E c , \( K = \sum {t_{i}^{3} b_{i} /3} \) is the St. Venant’s torsional constant and \( I_{\upomega \upomega } = \int_{A} {\upomega^{2} {\text{d}}A} \) is the principal sectorial moment of inertia, in which ω is the principal sectorial coordinate. For the support section, z = 0, denoting \( C = [{\text{ch}}(\alpha L/2) - 1]/[\alpha \cdot {\text{sh}}(\alpha L/2)], \) the warping moment at support can thus be obtained from Eq. (2) as:
The normal stress produced by the warping moment can be calculated by:
Thus, the maximum normal stress produced by the warping moment can be obtained by:
The maximal tensile stress under combined action of warping moment and bending moment can be obtained by adding Eqs. (1) and (5),
Introducing the tensile strength of concrete \( \sigma_{\hbox{max} } = 0.63\sqrt {f_{c}^{{\prime }} ({\text{MPa}})} \) and the T–M ratios of 1:5, 1:1 and 1:0 into Eq. (6), then the flexural cracking load of MEM-1:5, MEM-1:1 and MEM-1:0 can be obtained, respectively.
Apart from the three beam specimens tested in this paper, the cracking torque of the U-shaped thin-walled RC beam specimen under pure torsion tested by Krpan and Collins(1981a) is also calculated by the proposed method (denoted as MEM-Collins-1:0). The comparison of the testing results and calculated values was shown in Table 4. As shown in Table 4, the predictions of flexural cracking torque are good (with an average test/calculation ratio of 1.04) and the dispersion is acceptable (with a coefficient of variation of 11.5%).
4.2 Calculation of the Ultimate Load
Considering the interaction of bending normal stress and warping normal stress, for MEM-1:5 and MEM-1:1, the flexural failure modes have confirmed that the loaded half U-section is more critical than the unloaded half U-section (see details in Sects. 2.3 and 3.4). As for MEM-1:0, the flexural failure mode was dominated by the warping moment, the loaded half U-section was also critical as the unloaded half U-section. Therefore, for U-shaped thin-walled RC beams with different T–M ratios, the ultimate bearing capacity could be determined with the loaded half U-section at support and mid-span considering the combined actions of the bending moment and warping moment.
4.2.1 Equivalent Action Acting on the Loaded Half U-Section at Mid-Span
Under the warping moment, according to the theory (Vlasov 1961), the distribution of warping normal stress at mid-span was shown in Fig. 13. As shown in Fig. 13, since the warping moment is a self-balancing internal force, considering the anti-symmetrical distribution of warping normal stress about axis y1 and the interaction of warping normal stress and bending normal stress (superposition on the loaded half U-section while counteracting on the unloaded half U-section, details in Sect. 2.3), as well as considering the test results that the loaded half U-section was critical for all three beams, it is assumed that the effect of warping normal stress can be considered on two divided half-U-sections (i.e. loaded half U-section and unloaded half U-section). The warping normal stress acting on the loaded half U-section can be integrated as an equivalent moment \( M_{\text{eq}} = \int_{A} {\sigma_{\upomega } y_{1} \cdot {\text{d}}A} \) acting around the neutral axis and an axial force \( N_{\text{eq}} = \int_{A} {\sigma_{\upomega } {\text{d}}A} \) acting at the neutral axis. Also, the bending moment acting on the U-section can be considered on two divided half-U-sections, with 0.5 Mb for each. As a result, for MEM-1:5 and MEM-1:1 under combined actions of the warping moment and bending moment, a combined action of a moment Meq + 0.5 Mb and an axial force Neq act on the loaded half U-section. And for MEM-1:0, a moment Meq and an axial force Neq act on the loaded half U-section. Considering Eqs. (2) and (4), denoting \( \eta_{ 1} = \int_{A} {\upomega \cdot y_{1} \cdot {\text{d}}A} ,\;\eta_{ 2} = \int_{A} {\upomega \cdot {\text{d}}A} : \)

Equivalent action of normal stresses by warping moment at mid-span.
4.2.2 Ultimate Equilibrium Equation on the Loaded Half U-Section at Mid-Span
According to the method of calculating the bending capacity of RC shear walls (GB50010 2010), the stress distribution of the loaded half U-section at the ultimate stress state was shown in Fig. 14. The following four assumptions are made: (a) The compression was resisted by compressive concrete and compressive bars on the top, neglecting the contribution of distributing bars; (b) the contribution of tensile concrete is disregarded. The tension was resisted by bottom tensile bars and partial distributing bars; (c) All tensile bars at the bottom got ultimate strength, where the nonuniformity of warping normal stress in the bottom slab (Fig. 13) is neglected, considering that at the ultimate state, a longitudinal bar at measuring point 5 got ultimate strain (Figs. 9a, 10a and 11a); (d) since the stress near the neutral axis is low, only distributing bars located beyond 1.5 times the depth of the compression zone are considered to contribute to the tensile resistance.

Stress condition of the loaded half U-section at the ultimate state.
According to ACI 318-14 (2014), the compressive stress of concrete in the compression zone was represented by the equivalent rectangular stress block and has a uniform value of 0.85f c , where f c is the compressive strength of concrete obtained from the standard prism test. Thus, referring to Fig. 14, the axial force equilibrium equation and the moment equilibrium equation of the loaded half U-section can be derived as follows:
where Asd is the area of all distributing bars, x is the depth of a concrete equivalent rectangular stress block and the effective area of distributing bars can be expressed by Asd(h0 – 1.5x)/hd and f y and \( f_{y}^{{\prime }} \) are the ultimate tensile stress and compressive stress of longitudinal bars, respectively, where absolute value is applied for \( f_{y}^{{\prime }} \). Introducing the T–M ratios of 1:5, 1:1 and 1:0 into Eqs. (9) and (10), then the mid-span ultimate torque of MEM-1:5, MEM-1:1 and MEM-1:0 can be obtained, respectively. By the same algorithm, the support ultimate torques can be obtained, and the smaller one between the mid-span ultimate torque and the support ultimate torque is the true ultimate torque. To illustrate the proposed method, the calculation of cracking torque and ultimate torque of MEM-1:1 is shown in Appendix.
4.2.3 Comparison of Calculating Results and Testing Results
The ultimate capacities of the four beam specimens including MEM-Collins-1:0 are calculated with the proposed method. The comparison of testing results and calculating values was shown in Table 5. As shown in Table 5, the average ratio of the test results and predicted ultimate torque with the proposed method is 1.04, and the variation coefficient is 3.8%. This means that the proposed method can accurately predict the ultimate capacities of the U-shaped thin-walled RC beams under combined actions of bending, shear and torsion.
Also, the ultimate capacities are calculated with the method proposed by Elfgren et al. (1974) and with the method proposed by Luccioni et al. (1991). As can be seen from Table 5, according to the method proposed by Elfgren and Karlsson et al., the average ratio of test results and calculated results was 1.29, which should be attributed to the fact that the method based on the skew bending theory did not take into account the restrained torsion mechanism. For the calculation method proposed by Luccioni and Reimundin et al., as shown in Table 5, the average ratio of test results and predicted ultimate torques is 0.8. The reason for overestimating the ultimate capacities is that although the restrained torsion mechanism was considered, the effect of warping moment is underestimated.
5 Conclusions
Based on the testing results and analysis of the U-shaped thin-walled RC beams under different T–M ratios of 1:5, 1:1 and 1:0, the following conclusions could be drawn:
-
1.
Ductile flexural failures occurred on the three beam specimens, which were dominated by the combined actions of the bending moment and warping moment. Specifically, for T–M ratios of 1:5, flexural failure was mainly dominated by the bending moment; for T–M ratios of 1:1, flexural failure of the loaded half U-section was dominated by the combined action of the bending moment and warping moment, while normal stress resultant on the unloaded half U-section was very small; for T–M ratios of 1:0, antisymmetric flexural failure of the two webs was dominated by the warping moment.
-
2.
As the T–M ratio increased, the combined shear stress resultant of circulatory torque, warping torque and shear force increased, reflecting more diagonal cracks and larger stirrup strains.
-
3.
The three beam specimens under different T–M ratios showed good ductile performance, with a deflection ductility coefficient larger than 9.0 and rotational ductility coefficient larger than 8.0.
-
4.
A simple method to calculate the flexural cracking torque and the ultimate torque of the U-shaped thin-walled RC beams under combined actions of torsion, bending and shear was suggested, and the calculated results were corresponding well with the testing results.
References
ACI 318-14. (2014). Building code requirements for structural concrete (ACI 318-14). Farmington Hills, MI: American Concrete Institute.
Aminbaghai, M., Murin, J., Hrabovsky, J., & Mang, H. A. (2016). Torsional warping eigenmodes including the effect of the secondary torsion moment on the deformations. Engineering Structures, 106, 299–316.
Bernardo, L., Andrade, J., & Lopes, S. (2012a). Modified variable angle truss-model for torsion in reinforced concrete beams. Materials and Structures, 45(12), 1877–1902.
Bernardo, L., Andrade, J., & Lopes, S. (2012b). Softened truss model for reinforced NSC and HSC beams under torsion: A comparative study. Engineering Structures, 42, 278–296.
Bernardo, L. F. A., Andrade, J. M. A., & Nunes, N. C. G. (2015). Generalized softened variable angle truss-model for reinforced concrete beams under torsion. Materials and Structures, 7, 2169–2193.
Bernardo, L. F. A., Andrade, J. M. A., & Pereira-De-Oliveira, L. A. (2013). Reinforced and prestressed concrete hollow beams under torsion. Journal of Civil Engineering & Management, 19(2334), S141–S152.
Chen, S., Diao, B., Guo, Q., Ch, S., & Ye, Y. (2016a). Experiments and calculation of U-shaped thin-walled RC members under pure torsion. Engineering Structures, 106, 1–14.
Chen, S., Ye, Y., Guo, Q., Cheng, S., & Diao, B. (2016b). Nonlinear model to predict the torsional response of U-shaped thin-walled RC members. Structural Engineering & Mechanics, 60(6), 1039–1061.
Elfgren, L., Karlsson, I., & Losberg, A. (1974). Torsion-bending-shear interaction for concrete beams. Journal of the Structural Division, 100(8), 1657–1676.
Erkmen, R. E., & Mohareb, M. (2006). Torsion analysis of thin-walled beams including shear deformation effects. Thin-Walled Structures, 44(10), 1096–1108.
GB50010. (2010). Technical specification for concrete structures of tall building. Beijing: China Construction Industry Press.
Greene, G., & Belarbi, A. (2009a). Model for reinforced concrete members under torsion, bending, and shear. I: theory. Journal of Engineering Mechanics-Asce, 135(9), 961–969.
Greene, G., Jr., & Belarbi, A. (2009b). Model for reinforced concrete members under torsion, bending, and shear. II: Model application and validation. Journal of Engineering Mechanics—ASCE, 135(9), 970–977.
He, E. (2003). Application of channel girders in project of urban rail transit. Journal of Railway Engineering Society, 2, 13–16.
Hsu, T. T., & Mo, Y. (1985). Softening of concrete in torsional members—Theory and tests. ACI Journal Proceedings, 82(3), 290–303.
Hwang, C.-S., & Hsu, T. T. (1983). Mixed torsion analysis of reinforced concrete channel beams—A Fourier series approach. ACI Journal Proceedings, 80(5), 377–386.
Jeng, C. H. (2015). Unified softened membrane model for torsion in hollow and solid reinforced concrete members: modeling precracking and postcracking behavior. Journal of Structural Engineering. https://doi.org/10.1061/(ASCE)ST.1943-541X.0001212.
Jeng, C.-H., & Hsu, T. T. (2009). A softened membrane model for torsion in reinforced concrete members. Engineering Structures, 31(9), 1944–1954.
Krpan, P., & Collins, M. P. (1981a). Testing thin-walled open RC structure in torsion. Journal of the Structural Division, 107(6), 1129–1140.
Krpan, P., & Collins, M. P. (1981b). Predicting torsional response of thin-walled open RC members. Journal of the Structural Division, 107(6), 1107–1127.
Liang, L., Tadepalli, P. R., Mo, Y. L., & Hsu, T. T. C. (2016). Simulation of prestressed steel fiber concrete beams subjected to shear. International Journal of Concrete Structures and Materials, 10(3), 1–10.
Luccioni, B. M., Reimund, J. C., & Danesi, R. (1996). Thin-walled prestressed concrete members under combined loading. Journal of Structural Engineering, 3, 291–297.
Luccioni, B., Reimundin, J., Danesi, R., & Venant, S. (1991). Prestressed concrete I-beams under combined mixed torsion, flexure and shear. In ICE proceedings, Thomas Telford.
Mitchell, D., & Collins, M. P. (1974). Diagonal compression field theory—A rational model for structural concrete in pure torsion. ACI Journal Proceedings, 71, 396–408.
Murín, J., & Kutiš, V. (2008). An effective finite element for torsion of constant cross-sections including warping with secondary torsion moment deformation effect. Engineering Structures, 30(10), 2716–2723.
Pang, X. B., & Hsu, T. T. C. (1995). Behavior of reinforced concrete membrane elements in shear. ACI Structural Journal, 92(6), 665–679.
Pavazza, R. (2005). Torsion of thin-walled beams of open cross-section with influence of shear. International Journal of Mechanical Sciences, 47(7), 1099–1122.
Rahal, K. N. (2007). Combined torsion and bending in reinforced and prestressed concrete beams using simplified method for combined stress-resultants. ACI Structural Journal, 104(4), 402–411.
Rahal, K. N., & Collins, M. P. (1995a). Effect of thickness of concrete cover on shear-torsion interaction—An experimental investigation. ACI Structural Journal, 92(3), 334–342.
Rahal, K. N., & Collins, M. P. (1995b). Analysis of sections subjected to combined shear and torsion—A theoretical model. ACI Structural Journal, 92(4), 459–469.
Rahal, K., & Collins, M. P. (2003). Combined torsion and bending in reinforced and prestressed concrete beams. ACI Structural Journal, 100(2), 157–165.
Rahal, K. N., & Collins, M. P. (2006). Compatibility torsion in spandrel beams using modified compression field theory. ACI Structural Journal, 103(3), 328–338.
Tadepalli, P. R., Dhonde, H. B., Mo, Y. L., & Hsu, T. T. C. (2015). Shear strength of prestressed steel fiber concrete I-beams. International Journal of Concrete Structures and Materials, 9(3), 267–281.
Vecchio, F., & Collins, M. (1981). Stress–strain characteristics of reinforced concrete in pure shear. Final Report (pp. 211–225).
Vecchio, F. J., & Collins, M. P. (1986). The modified compression-field theory for reinforced concrete elements subjected to shear. ACI Journal Proceedings, 83(2), 219–231.
Vecchio, F. J., & Collins, M. P. (1988). Predicting the response of reinforced concrete beams subjected to shear using the modified compression field theory. ACI Structural Journal, 85(3), 258–268.
Vlasov, V. Z. (1961). Thin-walled elastic beams. Washington DC: Office of Technical Services, U.S. Department of Commerce.
Wang, Q., Qiu, W. L., & Zhang, Z. (2015). Torsion strength of single-box multi-cell concrete box girder subjected to combined action of shear and torsion. Structural Engineering and Mechanics, 55(5), 953–964.
Zbirohowski-Koscia, K. (1968). Stress analysis of cracked reinforced and prestressed concrete thin-walled beams and shells. Magazine of Concrete Research, 20(65), 213–220.
Acknowledgements
The funding from the National Natural Science Fund (NSF) of China (Grant No. 51778032 and 51278020), as well as the funding from the Texas Department of Transportation (Project No. 0-6914) are highly appreciated. Also, the scholarship funded by China Scholarship Council (CSC) with No. 201706020108 for the first author to study at the University of Houston is appreciated.
Author information
Authors and Affiliations
Corresponding author
Appendix: Calculation of MEM-1:1
Appendix: Calculation of MEM-1:1
The cracking torque and ultimate torque of MEM-1:1 are calculated to illustrate the proposed method.
-
(1)
Calculate the geometric properties of the U-section
The centroid coordinate and the principle sectorial coordinate on the U-section are respectively shown in Fig. 15a, b, according to which the moment of inertia is \( I = \int_{A} {y^{2} {\text{d}}A = 0.0029\,({\text{m}}^{4} )} , \) the circulatory torsional constant is \( K = \sum {t_{\text{i}}^{3} } h_{\text{i}} /3 = 0.0002\,({\text{m}}^{4} ) \) and the sectorial moment of inertia is \( I_{\upomega \upomega } = \int_{A} {w^{2} {\text{d}}A = 0.00034\,({\text{m}}^{6} )} . \)
Fig. 15 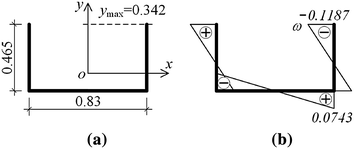
Geometric property of the U-section: a centroid coordinate and b principle sectorial coordinate.
-
(2)
Calculate the cracking torque
For MEM-1:1, the concrete modulus of elasticity is E = 34.5 × 10⁹ (Pa), and the shear modulus is taken as G = 0.4E = 13.8 × 10⁹ Pa. The circulatory torsional stiffness is \( GK = 2.76 \times 10^{6} {\text{Nm}}^{ 2} . \) The warping torsional stiffness is \( EI_{\upomega \upomega } = 1.173 \times 10^{7} {\text{Nm}}^{4} . \) The stiffness ratio is \( \alpha = \sqrt {GK/EI_{\upomega \upomega } } = 0.485\,{\text{m}}^{ - 1} . \) The quantity \( C = [{\text{ch}}(\alpha L/2) - 1]/[\alpha \cdot {\text{sh}}(\alpha L/2)] = 1.376\,{\text{m}}, \), where L = 6.65 m.
Substituting I, ymax, C, Iωω and ωmin into Eq. (6) gives:
$$ \alpha_{\hbox{max} } = \frac{{M_{\text{b}} }}{I}y_{ \hbox{max} } + \left( { - \frac{TC}{{2I_{\upomega \upomega } }}\upomega_{\hbox{min} } } \right) = \frac{{M_{\text{b}} }}{0.0029} \cdot 0.342 + \frac{1.376T}{0.00068} \cdot 0.1187 $$(11)Considering T: Mb = 1:1,
$$ \alpha_{\hbox{max} } = \frac{T}{0.0029}0.342 + \frac{1.376T}{0.00068} \cdot 0.1187 = 367.1T $$(12)Introducing the tensile strength of concrete \( f_{\text{t}} = 0.63\sqrt {f_{c}^{{\prime }} ({\text{MPa}})} = 3.75 \times 10^{6} \cdot {\text{Pa}} \) gives
$$ \sigma_{\hbox{max} } = 367.1T = f_{\text{t}} = 3.75 \times 10^{6} $$(13)Then the cracking torque Tcr = 10.2 kNm.
-
(3)
Calculate the ultimate torque
The ultimate torque of the beam specimen is the smaller one between the ultimate torque determined on the mid-span section and that determined on the support section. The algorithm is the same. Here, the mid-span ultimate torque is calculated to illustrate the calculation method. To obtain ultimate torque, the quantity \( \eta_{1} = \int\limits_{A} {\upomega \cdot y \cdot {\text{d}}A} = 4.738 \times 10^{ - 4} {\text{m}}^{5} \;{\text{and}}\;\eta_{2} = \int\limits_{A} {\upomega \cdot {\text{d}}A} = 1.581 \times 10^{ - 4} {\text{m}}^{4} \) are calculated first. Then Substitute C, Iωω, η1 and η2 into Eqs. (9) and (10); also substitute f y = 573.3 × 10⁶ Pa, \( f_{y}^{{\prime }} = 353.3 \times 10^{6} \,{\text{Pa}},\;A_{\text{s}} = 301.44 \times 10^{ - 6} \,{\text{m}}^{2} ,\,A_{\text{sd}} = 703.36 \times 10^{ - 6} \,{\text{m}}^{2} ,\;\,A_{\text{s}}^{{\prime }} = 100.48 \times 10^{ - 6} \,{\text{m}}^{2} ,\;\,{\text{h}}_{0} = 0.486\,{\text{m}},\;\,{\text{h}}_{\text{d}} = 0.472\,{\text{m}},\;\,{\text{h}}^{{\prime }} = 0.286\,{\text{m}},\;{\text{a}}^{{\prime }} = \,0.014\,{\text{m}},\;\,f_{c} = 35.4 \times 10^{6} \,{\text{Pa}} \) into Eqs. (9) and (10). Since T: Mb = 1:1, the bending moment M in the equations can be replaced by torque T:
$$ f_{y} A_{\text{s}} + f_{y} A_{\text{sd}} ({\text{h}}_{0} = 1.5x)/{\text{h}}_{\text{d}} - 0.85f_{c} {\text{b}}x - f_{y}^{{\prime }} A_{\text{s}}^{{\prime }} = \frac{TC}{{2I_{\upomega \upomega } }}\eta_{2} $$(14)$$f_{y} A_{\text{s}} ({\text{h}}_{0} = 0.5x) + f_{y} [A_{\text{sd}} ({\text{h}}_{0} - 1.5x)/{\text{h}}_{\text{d}} ](0.5{\text{h}}_{0} + 0.25x) + f_{y}^{{\prime }} A_{\text{s}}^{{\prime }} (0.5x - {\text{a}}^{{\prime }} ) = \left( {\,\frac{TC}{{2I_{\upomega \upomega } }}\eta_{1} + 0.5T} \right) + \frac{TC}{{2I_{\upomega \upomega } }}\eta_{2} ({\text{h}}^{{\prime }} - 0.5x)$$(15)Now, in Eqs. (14) and (15), only two unknown variables exist, which are torque T and compression depth x. Therefore, the ultimate torque at mid-span can be determined by the two coupling equations: T mdu = 88.5 kNm.
The ultimate torque at support can be determined by the same algorithm: T spu = 88.9 kNm. Thus, the ultimate torque of MEM-1:1 is Tu = 88.5 kNm.

Rights and permissions
Open Access This article is distributed under the terms of the Creative Commons Attribution 4.0 International License (http://creativecommons.org/licenses/by/4.0/), which permits unrestricted use, distribution, and reproduction in any medium, provided you give appropriate credit to the original author(s) and the source, provide a link to the Creative Commons license, and indicate if changes were made.
About this article

Cite this article
Xu, J., Chen, S., Guo, Q. et al. Experimental and Analytical Studies of U-Shaped Thin-Walled RC Beams Under Combined Actions of Torsion, Flexure and Shear. Int J Concr Struct Mater 12, 33 (2018). https://doi.org/10.1186/s40069-018-0245-8
Received:
Accepted:
Published:
DOI: https://doi.org/10.1186/s40069-018-0245-8